

Low correlation between household carbon monoxide and particulate matter concentrations from biomass-related pollution in three resource-poor settings
- PMID: 26245367
- PMCID: PMC4932836
- DOI: 10.1016/j.envres.2015.07.012
Low correlation between household carbon monoxide and particulate matter concentrations from biomass-related pollution in three resource-poor settings
Abstract
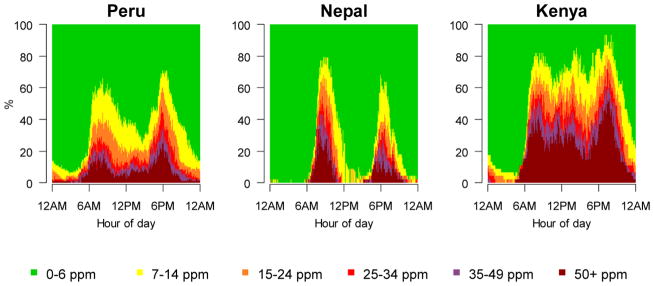
Household air pollution from the burning of biomass fuels is recognized as the third greatest contributor to the global burden of disease. Incomplete combustion of biomass fuels releases a complex mixture of carbon monoxide (CO), particulate matter (PM) and other toxins into the household environment. Some investigators have used indoor CO concentrations as a reliable surrogate of indoor PM concentrations; however, the assumption that indoor CO concentration is a reasonable proxy of indoor PM concentration has been a subject of controversy. We sought to describe the relationship between indoor PM2.5 and CO concentrations in 128 households across three resource-poor settings in Peru, Nepal, and Kenya. We simultaneously collected minute-to-minute PM2.5 and CO concentrations within a meter of the open-fire stove for approximately 24h using the EasyLog-USB-CO data logger (Lascar Electronics, Erie, PA) and the personal DataRAM-1000AN (Thermo Fisher Scientific Inc., Waltham, MA), respectively. We also collected information regarding household construction characteristics, and cooking practices of the primary cook. Average 24h indoor PM2.5 and CO concentrations ranged between 615 and 1440 μg/m(3), and between 9.1 and 35.1 ppm, respectively. Minute-to-minute indoor PM2.5 concentrations were in a safe range (<25 μg/m(3)) between 17% and 65% of the time, and exceeded 1000 μg/m(3) between 8% and 21% of the time, whereas indoor CO concentrations were in a safe range (<7 ppm) between 46% and 79% of the time and exceeded 50 ppm between 4%, and 20% of the time. Overall correlations between indoor PM2.5 and CO concentrations were low to moderate (Spearman ρ between 0.59 and 0.83). There was also poor agreement and evidence of proportional bias between observed indoor PM2.5 concentrations vs. those estimated based on indoor CO concentrations, with greater discordance at lower concentrations. Our analysis does not support the notion that indoor CO concentration is a surrogate marker for indoor PM2.5 concentration across all settings. Both are important markers of household air pollution with different health and environmental implications and should therefore be independently measured.
Keywords: Biomass fuel smoke; Carbon monoxide; Particulate matter; Rndomized field trial.
Published by Elsevier Inc.
Figures


References
-
- Smith KR, Bruce N, Balakrishnan K, Adair-Rohani H, Balmes J, Chafe Z, Dherani M, Hosgood HD, Mehta S, Pope D, Rehfuess E HAP CRA Risk Expert Group. Millions dead: how do we know and what does it mean? Methods used in the Comparative Risk Assessment of household air pollution. Annu Rev Public Health. 2014;35:185–206. - PubMed
-
- Gordon SB, Bruce NG, Grigg J, Hibberd PL, Kurmi OP, Lam KB, Mortimer K, Asante KP, Balakrishnan K, Balmes J, Bar-Zeev N, Bates MN, Breysse PN, Buist S, Chen Z, Havens D, Jack D, Jindal S, Kan H, Mehta S, Moschovis P, Naeher L, Patel A, Perez-Padilla R, Pope D, Rylance J, Semple S, Martin WJ., 2nd Respiratory Risks From Household Air Pollution in Low and Middle Income Countries. Lancet Respir Med. 2014;2(10):823–60. - PMC - PubMed
Publication types
MeSH terms
Substances
Grants and funding
LinkOut - more resources
Full Text Sources
Other Literature Sources
Medical
