. 2015 Aug 13;524(7564):180-5.
doi: 10.1038/nature14863. Epub 2015 Aug 5.

Self-renewing diploid Axin2(+) cells fuel homeostatic renewal of the liver

Affiliations

Self-renewing diploid Axin2(+) cells fuel homeostatic renewal of the liver

Bruce Wang et al. Nature. .

Abstract

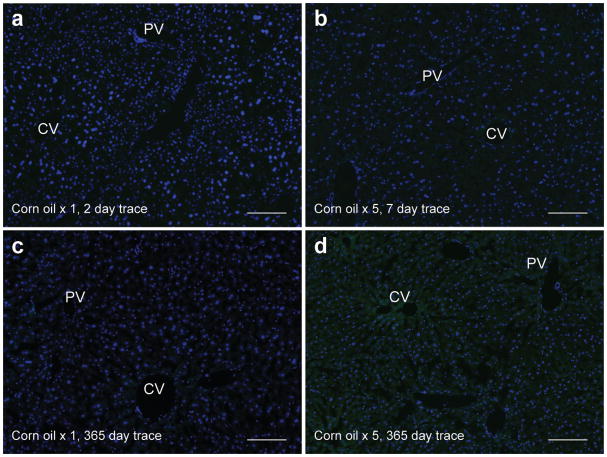
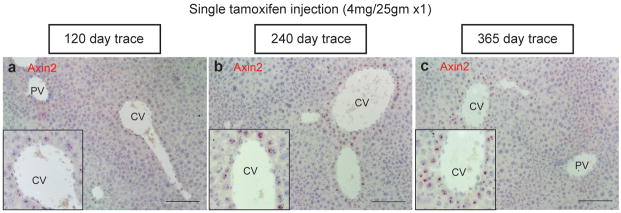
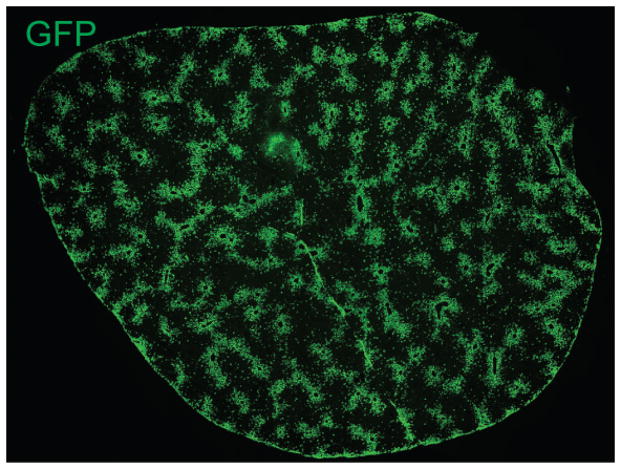
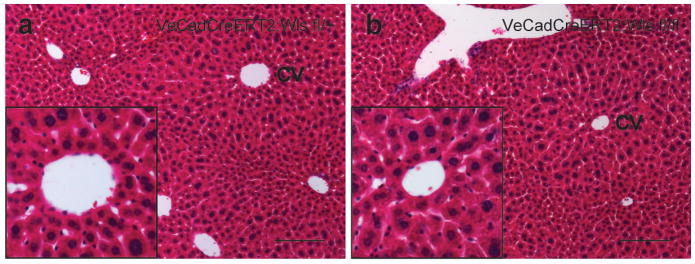
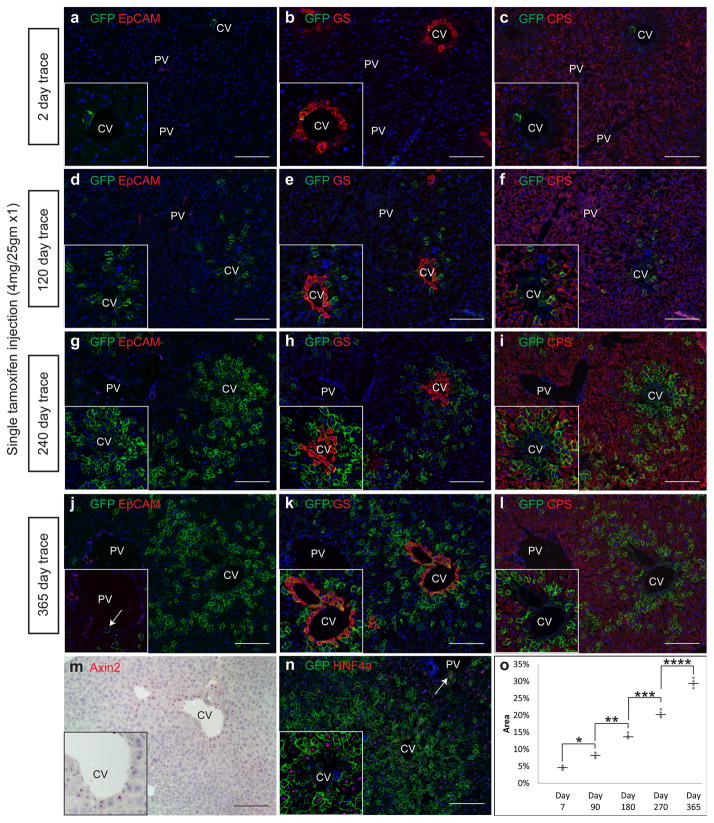
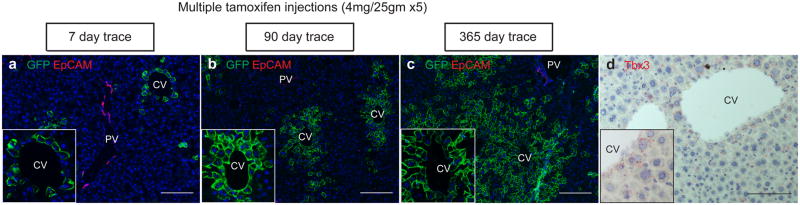
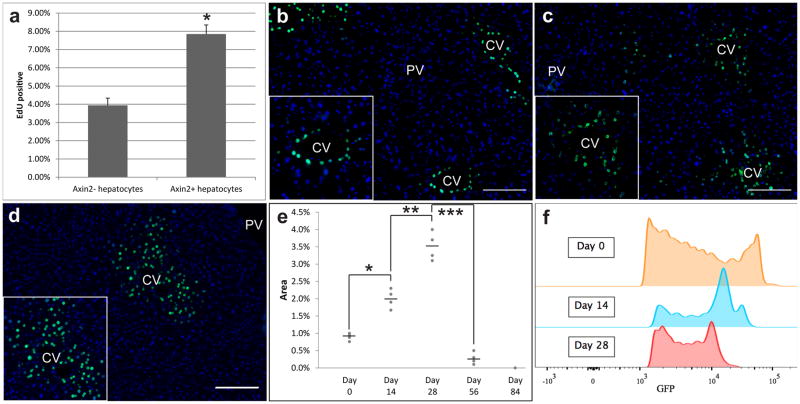
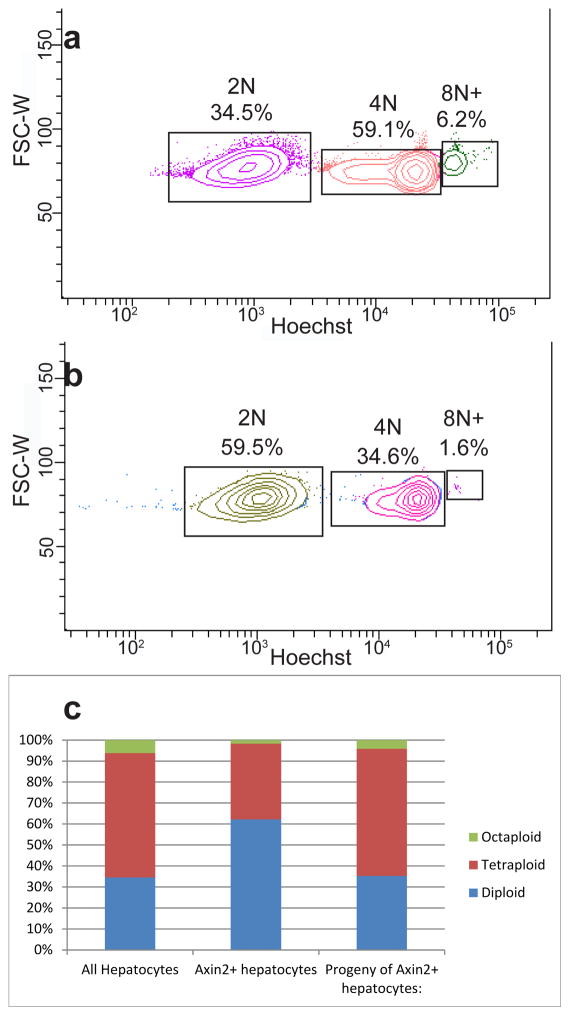
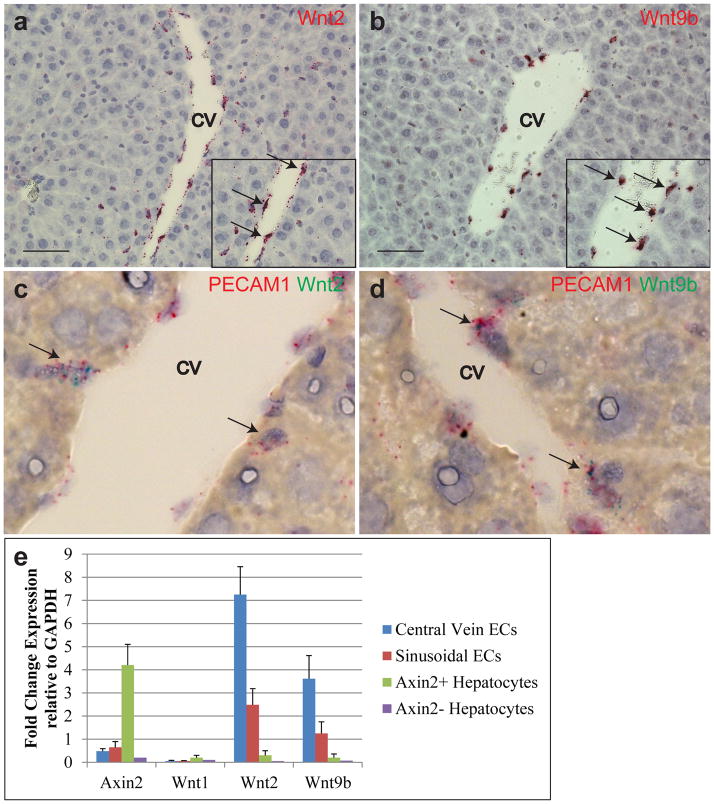
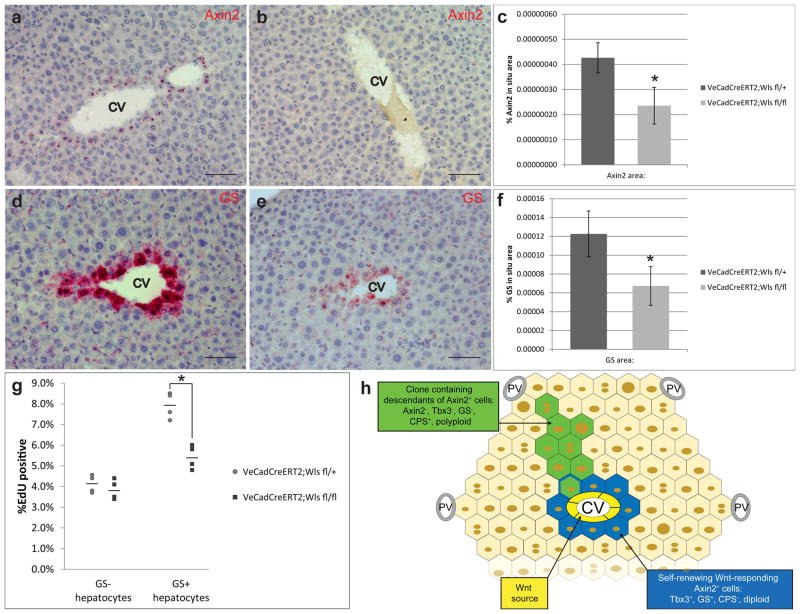
The source of new hepatocytes in the uninjured liver has remained an open question. By lineage tracing using the Wnt-responsive gene Axin2 in mice, we identify a population of proliferating and self-renewing cells adjacent to the central vein in the liver lobule. These pericentral cells express the early liver progenitor marker Tbx3, are diploid, and thereby differ from mature hepatocytes, which are mostly polyploid. The descendants of pericentral cells differentiate into Tbx3-negative, polyploid hepatocytes, and can replace all hepatocytes along the liver lobule during homeostatic renewal. Adjacent central vein endothelial cells provide Wnt signals that maintain the pericentral cells, thereby constituting the niche. Thus, we identify a cell population in the liver that subserves homeostatic hepatocyte renewal, characterize its anatomical niche, and identify molecular signals that regulate its activity.


Conflict of interest statement

The authors declare no competing financial interests.

Figures

Extended figure 1
Extended figure 1. Leakiness in Axin2-CreERT2;Rosa26-mTmGflox mice is not observed in corn oil injected animals
No GFP labeling is seen in Axin2-CreERT2;Rosa26-mTmGflox mice after a single dose of corn oil and traced for two days (a) or 365 days (c). No GFP labeling is seen after five consecutive daily doses of corn oil and traced for seven days (b) or 365 days (d). All animals were 8 week old Axin2-CreERT2;Rosa26-mTmGflox mice. Images are representative images from n = 5 mice per condition and time point. CV = central vein, PV = portal vein. Scale bars: 100 μm.
Extended figure 2
Extended figure 2. Axin2 expression remains restricted to pericentral cells
In situ hybridization for Axin2 in (a) 120 day trace, (b) 240 day trace and (c) 365 day trace Axin2-CreERT2;Rosa26-mTmGflox mice. Representative in situ images are from n = 5 animals per time point. CV = central vein, PV = portal vein. Scale bars: 100 μm.
Extended figure 3
Extended figure 3. Descendants of Axin2+ cells replaced 30% of the area of the liver
Tiled image of entire liver section of a 365 day trace Axin2-CreERT2;Rosa26-mTmGflox mice. Image is representative of n = 5 animals at this time point.
Extended figure 4
Extended figure 4. FACS sorting gates for GFP+ cells in Axin2-rtTA;TetO-H2B-GFP mice
8 week old Axin2-rtTA;TetO-H2B-GFP mice were labeled with doxycycline for 7 days and chased for various lengths of time. Hepatocytes were enzymatically dispersed and sorted by FACS. Successive gating shows sequential selection of (a) all hepatocytes, (b) single cells by forward scatter, (c) side scatter. d, Dead cells were excluded by propidium iodide labeling. e, GFP positive cells were gated and either sorted for RNAseq analysis or further graphed as histograms for GFP intensity analysis (see figure 3g).
Extended figure 5
Extended figure 5. Axin2 gene dosage and tamoxifen have no effect on pericentral hepatocyte proliferation rate
WT and Axin2CreERT2+/− mice were given EdU daily for seven days. A subset of WT and Axin2CreERT2+/− mice was given 4mg/25gram body weight of tamoxifen daily for 5 days. Pericentral hepatocytes were identified by HNF4α+/GS+ staining. All other hepatocytes were identified by HNF4α+/GS antibody staining. The EdU positive rates within the two hepatocyte populations as a percentage of total HNF4a+ cells were essentially the same regardless of Axin2 gene dosage or tamoxifen administration. n = 5 animals per group. Data represent mean ± s.e.m. *, **, ***, **** p > 0.05.
Extended figure 6
Extended figure 6. Axin2+ hepatocytes proliferate rapidly
Axin2-rtTA;TetO-H2B-GFP mice were given doxycycline for 7 days. a, 56 days after cessation of doxycycline, very few GFP+ cells are seen around the central vein. b, After 84 days, no GFP+ cells are seen. Images are representative of n = 4 animals per time point.
Extended figure 7
Extended figure 7. FACS sorting gates for GFP+ cells in Axin2-CreERT2;Rosa26-mTmGflox mice for ploidy analysis
8 week old Axin2-CreERT2;Rosa26-mTmGflox mice were labeled with five daily doses of tamoxifen and traced for seven days. Hepatocytes were enzymatically dispersed and sorted by FACS. Successive gating show sequential selection of (a) all hepatocytes, (b) single cells by forward scatter, (c) side scatter. d, Dead cells were excluded by propidium iodide labeling. e, GFP positive cells were gated and graphed as histograms for Hoechst staining (see figure 4).
Extended figure 8
Extended figure 8. FACS sorting gates for endothelial cells
8 week old wildtype C57B6 mice were used for endothelial cell isolation. Livers were enzymatically digested, hepatocytes were removed by centrifugation and nonparenchymal cells were antibody stained and sorted by FACS. Successive gating showed sequential selection of (a) non-parenchymal cells by size, (b) single cells by forward scatter, (c) side scatter. d, Dead cells were excluded by DAPI labeling. e, endothelial cells were identified by CD31-PE positive staining. f, Sinusoidal endothelial cells (SEC) were identified as CD34-FITC+ VEGFR3-APC+ while central vein endothelial cells (CEC) were identified as CD34-FITC+VEGFR3-APC.
Extended figure 9
Extended figure 9. Histology of VE-cadherin-CreERT2;Wlsflox/flox animal versus control
a, Control (VE-cadherin-CreERT2;Wlsflox/+) animals given 5 daily doses of tamoxifen and traced for 7 days after the last tamoxifen dose. H&E of the liver shows normal histology. b, Wls knockout animals (VE-cadherin-CreERT2;Wlsflox/flox) also showed normal liver histology. Images are representative images from n = 5 animals per group. Insets show central veins. Scale bars = 100 μm.
Figure 1
Figure 1. Axin2+ pericentral cells generate expanding clones of hepatocytes from the central vein towards the portal vein over time
a, Few pericentral hepatocytes are labeled in Axin2-CreERT2;Rosa26-mTmGflox mice following a single dose of tamoxifen and traced for two days. EpCam labels bile ducts. Labeled pericentral cells express GS (b) but not CPS (c). d, 120 day trace, g, 240 day trace, j, 365 day trace show expansion of labeled cells which can replace hepatocytes at the portal vein (j inset, arrow). Pericentral cells maintain GS expression (e, h, k), while labeled progeny acquire CPS expression (f, i, l). m, in situ hybridization for Axin2. n, All labeled cells express HNF4a, including cells at the portal vein (arrow). o, Quantification of labeled hepatocytes over time. Data shows individual measurements and the mean. n = 4 animals for each time point. *, **, ***, **** p < 0.05, two-tailed unpaired t-tests. CV = central vein. PV = portal vein. Scale bars = 100 μm.
Figure 2
Figure 2. Axin2+ cells self-renew
a, The majority of pericentral hepatocytes are labeled in Axin2-CreERT2;Rosa26-mTmGflox mice given 5 doses of tamoxifen and traced for 7 days. b, 90 day trace, c, 365 day trace show all pericentral cells remain labeled (see insets). Note that non-labeled cells do not occupy the pericentral region over time. d, in situ hybridization of Tbx3. CV = central vein. PV = portal vein. Scale bars = 100 μm.
Figure 3
Figure 3. Axin2+ hepatocytes proliferate faster than other hepatocytes
a, Quantification of % EdU+ cells within the Axin2 and Axin2+ hepatocyte populations. Data represent mean ± s.e.m. n = 5 animals. * p < 0.05, two-tailed unpaired t-tests. b, All pericentral hepatocytes are labeled with nuclear GFP in Axin2-rtTA;TetO-H2B-GFP mice given doxycycline for 7 days. c, 14 day chase, d, 28 day chase after doxycycline. e, quantification of GFP labeled nuclei. Data shows individual measurements and the mean. n = 4 animals per group. *, **, *** p < 0.05, two-tailed unpaired t-tests. f, GFP intensity in day 0, day 14 and day 28 chase animals. CV = central vein. PV = portal vein. Scale bars = 100 μm.
Figure 4
Figure 4. Axin2+ hepatocytes are mostly diploid
a, FACS plot of hepatocytes stained with Hoechst 33342 and gated for diploid (2N), tetraploid (4N) and octaploid or greater (8N+) cells. b, FACS plot of Axin2+ hepatocytes stained with Hoechst 33342. c, Ploidy distribution within unsorted hepatocyte population (left), Axin2+ hepatocyte population (center), or labeled hepatocytes after one year lineage trace (right). n = 3 animals per group.
Figure 5
Figure 5. Central vein endothelial cells produce Wnts and act as a niche for pericentral cells
In situ hybridization of Wnt2 (a) and Wnt9b (b) showing mRNA expression at the central vein in endothelial cells (arrows, inset). Co-in situ hybridization of PECAM1 (red) and Wnt2 (green) (c) and PECAM1 and Wnt9b (d) showing co-expression in endothelial cells lining the central vein (arrows). e, Quantitative RT-PCR of Axin2, Wnt1, Wnt2 and Wnt9b of FACS isolated liver cells. Data represent mean ± s.e.m. n = 5 animals. Scale bars = 100 μm.
Figure 6
Figure 6. Central vein derived Wnts are required for pericentral cell proliferation
a, Axin2 in situ hybridization in Wls f/+, and b, Wls f/f mice. c, Quantification of Axin2 in situ signal. Data represent mean ± s.e.m. n = 5 animals per group. * p < 0.05, two-tailed unpaired t-tests. d, GS in situ hybridization in Wls f/+, and e, Wls f/f mice. f, Quantification of GS in situ signal. Data represent mean ± s.e.m. n = 5 animals per group. * p < 0.05, two-tailed unpaired t-tests. g, Quantification of % EdU+ cells within GS or GS+ hepatocyte populations in Wls fl/+ and Wls fl/fl animals. Data shows individual measurements and the mean. n = 4 animals per group. * p < 0.05, two-tailed unpaired t-tests. Figure 6h: Schematic of hepatocyte homeostatic renewal by pericentral cells. Scale bars = 100 μm.

Comment in

References

    1. Malato Y, et al. Fate tracing of mature hepatocytes in mouse liver homeostasis and regeneration. J Clin Invest. 2011;121(12):4850–60. - PMC - PubMed
    1. Yanger K, et al. Adult hepatocytes are generated by self-duplication rather than stem cell differentiation. Cell Stem Cell. 2014;15(3):340–9. - PMC - PubMed
    1. Miyajima A, Tanaka M, Itoh T. Stem/Progenitor Cells in Liver Development, Homeostasis, Regeneration, and Reprogramming. Cell Stem Cell. 2014;14(5):561–574. - PubMed
    1. Jungermann K, Kietzmann T. Zonation of parenchymal and nonparenchymal metabolism in liver. Annu Rev Nutr. 1996;16:179–203. - PubMed
    1. Ganem NJ, Pellman D. Limiting the proliferation of polyploid cells. Cell. 2007;131(3):437–40. - PubMed

Publication types

MeSH terms

Associated data