. 2015 Aug 13;524(7564):247-51.
doi: 10.1038/nature14884. Epub 2015 Aug 5.

Crucial HSP70 co-chaperone complex unlocks metazoan protein disaggregation

Affiliations

Crucial HSP70 co-chaperone complex unlocks metazoan protein disaggregation

Nadinath B Nillegoda et al. Nature. .

Abstract

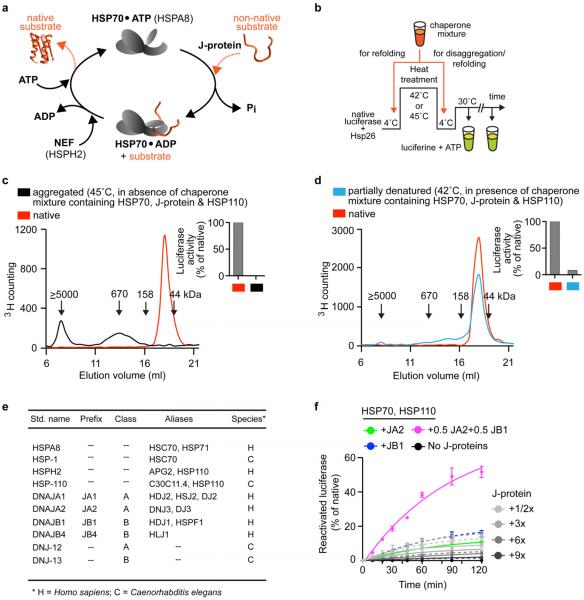
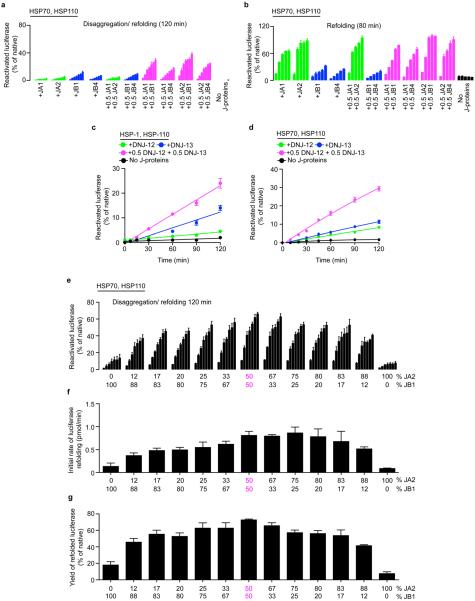
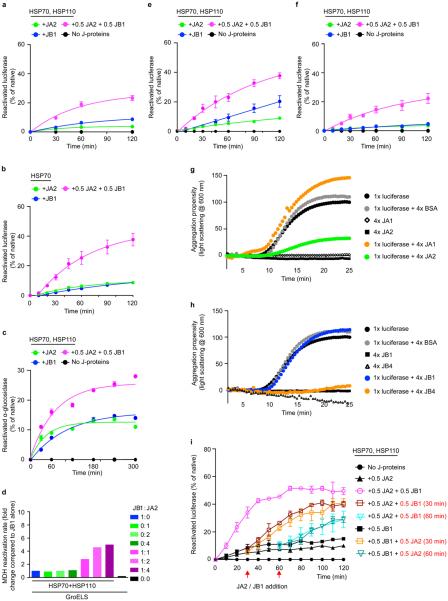
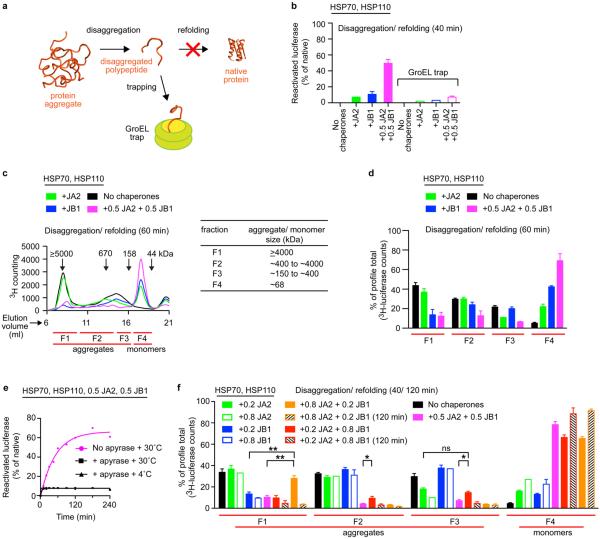
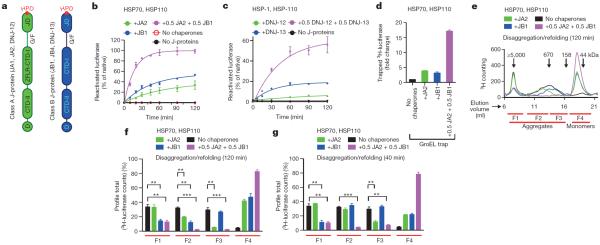
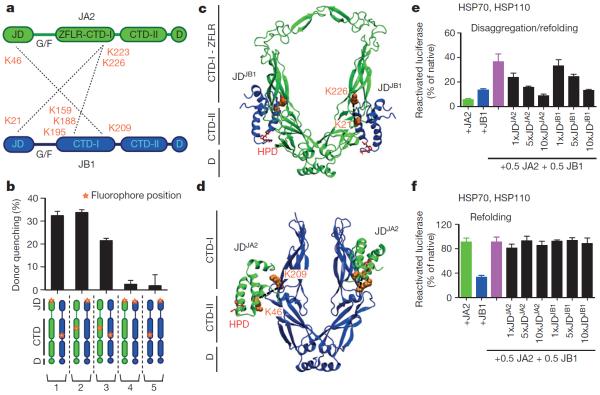
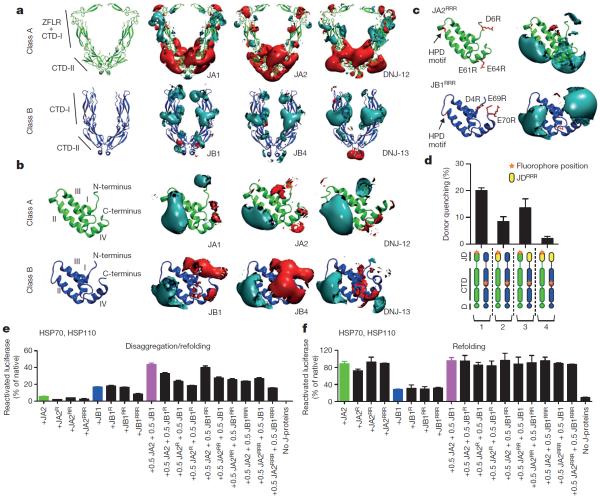
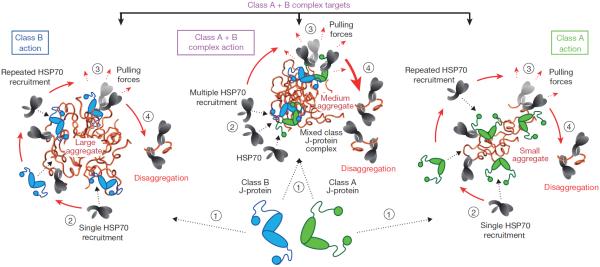
Protein aggregates are the hallmark of stressed and ageing cells, and characterize several pathophysiological states. Healthy metazoan cells effectively eliminate intracellular protein aggregates, indicating that efficient disaggregation and/or degradation mechanisms exist. However, metazoans lack the key heat-shock protein disaggregase HSP100 of non-metazoan HSP70-dependent protein disaggregation systems, and the human HSP70 system alone, even with the crucial HSP110 nucleotide exchange factor, has poor disaggregation activity in vitro. This unresolved conundrum is central to protein quality control biology. Here we show that synergic cooperation between complexed J-protein co-chaperones of classes A and B unleashes highly efficient protein disaggregation activity in human and nematode HSP70 systems. Metazoan mixed-class J-protein complexes are transient, involve complementary charged regions conserved in the J-domains and carboxy-terminal domains of each J-protein class, and are flexible with respect to subunit composition. Complex formation allows J-proteins to initiate transient higher order chaperone structures involving HSP70 and interacting nucleotide exchange factors. A network of cooperative class A and B J-protein interactions therefore provides the metazoan HSP70 machinery with powerful, flexible, and finely regulatable disaggregase activity and a further level of regulation crucial for cellular protein quality control.


Figures

Extended data Figure 1
Extended data Figure 1. Characterization of protein disaggregation/refolding and refolding-only reactions
a, HSP70–J-protein–HSP110 (HSPA8–J-protein–HSPH2) functional cycle. Concomitant interaction of HSP70 with a J-protein and substrate results in allosteric stimulation of ATP hydrolysis; this traps the substrate in HSP70 (ref. 8). Subsequent NEF (for example, HSP110) promoted ADP dissociation from HSP70, then allows ATP rebinding, which triggers substrate release to complete the cycle,. b, Scheme for in vitro disaggregation/refolding and refolding-only reactions. The aggregates used in disaggregation/refolding assays are preformed by heating luciferase with yeast small heat-shock protein (sHSP) Hsp26 (ref. 4), which is known to co-aggregate with misfolded proteins in vivo, (see Methods for detailed description). If HSP70, J-protein and HSP110 are instead heated together with substrate and Hsp26, luciferase is denatured into a more easily refoldable, inactive and largely monomeric substrate form used in refolding-only assays. c, SEC profiles of aggregated 3H-labelled luciferase (black; size range 200 kDa to ≥5,000 kDa representing ~2 to >50 aggregated luciferase molecules) and monomeric native luciferase (red; size ~63 kDa). Arrows indicate elution size (kDa). Inset, activity of loaded material. d, SEC profile of partially denatured and largely monomeric luciferase (starting material for refolding-only reactions). Inset, activity of loaded material. e, Chaperone nomenclature. f, Disaggregation and reactivation of preformed luciferase aggregates using human HSP70–HSP110 with human J-proteins JA2, green; JB1, blue; JA2+JB1, magenta or no J-protein, black. Under limiting chaperone (HSP70/HSP110) and increasing J-protein concentrations (A, solid or B, dashed) (n = 3). Data are mean ± s.e.m. Precise concentrations are shown in Extended Data Table 1.
Extended data Figure 2
Extended data Figure 2. Effects of mixed-class J-proteins on disaggregation/refolding and refolding-only activity of the HSP70 system
a, Disaggregation/refolding of aggregated luciferase compared for human class A (JA1 and JA2) and class B (JB1 and JB4) J-proteins (n = 3). b, Luciferase refolding-only compared for JA1, JA2, JB1 and JB4 (n = 3). c, Reactivation of heat-aggregated luciferase with nematode HSP70 machinery, using reduced substrate:HSP70 ratio of 1:20, containing DNJ-12 (A), DNJ-13 (B) or DNJ-12+DNJ-13 (A+B) (n = 2). d, Disaggregation/refolding of luciferase using human HSP70 and HSP110 combined with nematode J-proteins (n = 3). e, Reactivation of luciferase showing optimal JA2:JB1 ratio for disaggregation/refolding (n = 2). f, Initial disaggregation/refolding rates for e. g, Final yields of refolded luciferase (120 min) for e. Data are mean ± s.e.m. Precise concentrations are shown in Extended Data Table 1.
Extended data Figure 3
Extended data Figure 3. Disaggregation synergy is independent of sHSP incorporation, NEF, substrate and aggregate character, and is not explained by sequential J-protein class activity
a, Disaggregation/refolding reaction for luciferase aggregates without incorporating sHSP Hsp26 (n = 3). b, Reactivation without NEF (HSPH2) (n = 3). c, Reactivation of α-glucosidase aggregates (n = 3). d, Reactivation of preformed MDH aggregates in the presence of GroEL plus the GroES protein foldase system (GroELS) (n = 2). GroELS is required for efficient MDH refolding. GroELS alone is in black. JB1:JA2 denotes the stoichiomety of each reaction. e, Disaggregation/refolding of stringent aggregates (≥5,000 kDa) formed using 2 μM luciferase (n = 3). f, Disaggregation/refolding of aggregated luciferase at reduced substrate:HSP70 ratio (luciferase:HSP70:J-protein:HSP110 = 1:7.5:3.8:0.4) (n = 3). The aggregated luciferase concentration is 100 nM. g, h, Holdase function of J-proteins (class A (g) and class B (h)) during luciferase aggregation at 42 °C, shown by decreased light scattering. Concentrations: 1× luciferase; 4× J-protein; 4× BSA (control) (n = 2). i, Reactivation with sequential JA2 and JB1 addition. J-protein added at t = 0 min (black graph legends); J-protein added after 30 or 60 min (red graph legends and arrows) (n = 2). Data are mean ± s.e.m. Precise concentrations are shown in Extended Data Table 1.
Extended data Figure 4
Extended data Figure 4. Stoichiometry of class A and B J-proteins determines the range of aggregate sizes resolved
a, The GroEL trap (GroELD87K) facilitates the capture of 3H-luciferase monomers liberated by protein disaggregation before the refolding step. b, Refolding of disaggregated 3H-luciferase monomers (40 min) in the absence (solid bars) and presence of GroEL trap (open bars). c, SEC profile after disaggregation/refolding of aggregated tritiated α-glucosidase (60 min) with either J-protein class alone (green (A) or blue (B)) or J-proteins combined (magenta). Control reaction without chaperones (black). Elution fractions F1–F4 (red lines). Table shows size distribution of aggregates in each fraction; F1 luciferase aggregates ≥4,000 kDa; F2, aggregates ~400–4,000 kDa; F3, aggregates ~150–400 kDa, F4 disaggregated monomers (~68 kDa). d, Quantification of SEC profile measuring disaggregation of tritiated α-glucosidase from aggregates (F1–F3) from c, also showing concomitant accumulation of disaggregated monomer (F4) from c (n = 3). e, ATP depletion by apyrase abrogates disaggregation. f, Quantification of SEC profile measuring disaggregation of tritiated luciferase from aggregates (F1–F3) with concomitant accumulation of disaggregated monomer (F4), using the HSP70–HSP110 system with JA2 or JB1 alone, or with JA2 plus JB1. Stoichiometry range used for JA2:JB1, 1:1 to 4:1 to 1:4. Specifically, 0.2 JB1:0.8 JA2 (orange); 0.2 JA2:0.8 JB1 (red). Solid colours denote 40-min reaction time; hash denotes 120 min. Control reaction without chaperones (black). Two-tailed t-test, *P<0.05, **P<0.01 (n = 3). Data are mean ± s.e.m. Precise concentrations are shown in Extended Data Table 1.
Extended data Figure 5
Extended data Figure 5. JA2 and JB1 form homodimers and interact transiently
a, Identified JA2 and JB1 inter-molecular cross-links; `Id', amino acid sequence of peptides showing cross-linked lysines (K, orange). Protein 1 and 2 denote source proteins for cross-linked peptides; position 1 and 2 denote positions of cross-linked lysines within proteins; deltaS is the delta score for each crosslink; cut-off = 0.9. ld-Score is the linear discriminant score. b, Representative mass spectrometry spectra for inter-molecular JA2 and JB1 cross-links. Common peaks, green; cross-linked, red; matched peaks, diamonds (no peaks above 1,100 m/z detected). c, SEC profiles of 3H-labelled JA2 dimer (green cartoon) and 3H-labelled JB1 dimer (blue cartoon) mixed with unlabelled J-protein from the other class. Precise concentrations are shown in Extended Data Table 1.
Extended data Figure 6
Extended data Figure 6. Electrostatic interactions between J-domain and CTD predominate in JA2 and JB1 complexes
a, FRET efficiencies for JD–CTD and CTD–CTD interactions with 0–0.2% Tween20 titration. Percentage efficiency is relative to untreated (0% Tween20) samples. Donor quenching (black); acceptor fluorescence (red); below, fluorophore positions in J-protein protomers (JA2, green; JB1, blue). N-termini of JDJA2 and JDJB1 labelled with acceptor fluorophore ReAsH. CTDJA2 and CTDJB1 labelled with donor fluorophores FlAsH and Alexa Fluor 488 at residues 241 and 278, respectively. b, Disaggregation/refolding of preformed luciferase by JA2 and/or JB1 with increasing amounts of Tween20 (n = 2). c, FRET efficiencies for JA2 and JB1 interactions at increasing salt concentrations. d, Disaggregation/refolding of preformed luciferase aggregates by JA2 and JB1 with increasing salt concentrations; control, 50 mM salt, no chaperones (n = 2). e, Luciferase disaggregation/refolding in the presence of excess J-domain fragments carrying JD-QPNJA2/JB1 mutation of the HPD motif (n = 3). f, g, FRET between class A and B J-proteins. f, Competition with unlabelled full-length wild-type J-protein (FL); unlabelled competitor is 1–10× acceptor; (–), no competitor. g, Competition with unlabelled isolated JDJA2 and JDJB1. Data are mean ± s.e.m., average of at least two experiments for FRET experiments. Precise concentrations are shown in Extended Data Table 1.
Extended data Figure 7
Extended data Figure 7. In silico prediction of JD–CTD interactions between class A and B J-proteins and in vitro evidence that physical interactions between J-proteins do not overlap J-protein substrate binding sites
a, Preferred positions of the centres of geometry (CoG) of J-domains (y axis, JA1, JA2, JB1 and JB4) around CTD dimers (x axis, class A, green, class B, blue) obtained from molecular docking simulations. JDJA1/JB1, wireframe meshes; JDJA2/JB4, brown contours, each contoured at the isovalue given in the top left of each image. The higher scores for class A CTDs indicate greater specificity of the complexes formed with J-domains; the lower scores for class B CTDs indicate much less specific interactions. Lysines in inter- and intra-J-protein JA2–JB1 cross-links, orange spheres. b, Properties of the docking arrangements obtained after clustering. Total number of clusters per simulation, denominator; number of selected clusters (corresponding to 90% of all docked complexes), numerator, bold. In parentheses, the range of average energy values (in units of kT) for the selected clusters. Lower energy values indicate more favourable binding; fewer clusters indicate a more defined binding mode (see Methods). JDJA2 docking to CTDJB1 is much weaker and less specific than JDJB1 docking to CTDJA1, but docking arrangements compatible with cross-linking results still obtain (Fig. 2d). c, Competition of isolated JDJA2 fragments against JA2 holdase function in luciferase aggregation at 42 °C (n = 2). d, Competition of isolated JDJB1 fragments against JA2 holdase function (n = 2). Luciferase, 1×; JA2, 4×; isolated J-domain fragments, 20× (red; 5-fold excess over JA2), or 40× (orange; 10-fold excess over JA2). Light scattering measured at 600 nm. Precise concentrations are shown in Extended Data Table 1.
Extended data Figure 8
Extended data Figure 8. Possible configurations of the JA2–JB1 mixed-class complex
a, Compact configuration. b, Open configuration. Configurations were derived from computational docking, using constraints from experimental FRET and cross-linking data (Fig. 2a–d and Extended Data Fig. 5a). Each configuration is shown from two views (left and right) rotated by 135 degrees with respect to each other and in ribbon (top) and molecular surface (bottom) representations. In both cases J-domains of JA2 dock onto the CTD dimer of JB1, and similarly J-domains of JB1 dock to the CTD dimer of JA2. Both CTDJB1 protomers are within cross-linking distance of CTDJA2. Unstructured glycine/phenylalanine (G/F)-rich flexible regions connecting J-domains and CTDs shown by dark blue (JB1) or green (JA2) dashed lines. Residues at FRET fluorophore sites are shown in space-filling representation (red on JA2, magenta on JB1). Inter-molecular crosslinking lysine pairs (gold and cyan, space-filling) are connected by dotted lines. Bottom left within a: molecular surface representation of compact configuration of the JA2–JB1 complex, showing substrate binding sites from crystallographic (yellow) and biochemical (orange, cyan) data. HPD motif, red. Residues implicated in JD–HSP70 interactions,, (dark teal and dark green on JDJA2; purple and dark blue on JDJB1). Bottom right within a: rotated image. Table shows fluorophore separation distances; calculated percentage FRET efficiencies in parentheses. a, Both CTDJB1 protomers are within cross-linking distance of CTDJA2. b, As in a, but with only a single CTDJB1 protomer within cross-linking distance to CTDJA2; one JDJA2 docks onto CTDJB1, the other JDJA2 is free. Similarly, one JDJB1 docks onto CTDJA2, the other JDJB1 docks onto its own CTD, consistent with SAXS-determination of class B J-proteins,. Model of JB1 (blue) based on the crystal structure of CTD and NMR structure of J-domain. Homology model of JA2 (green) based on the crystal structure of Ydj1 (see Methods).
Figure 1
Figure 1. Simultaneous presence of class A and B J-proteins unleashes protein disaggregation activity and broadens target aggregate range of the HSP70 machinery
a, Two distinct classes (A and B) display highly conserved domain organization involving the HSP70-intertacting HPD motif (red) containing amino-terminal J-domain (JD), Gly/Phe-rich flexible region (G/F), C-terminal β-sandwich domains (CTD-I and II), with class A J-proteins distinguished mainly by a zinc-finger-like region (ZFLR) that inserts into the CTD-I subdomain and a dimerization domain (D),. CTD together with ZFLR provide substrate specificity,. b, Disaggregation and reactivation of preformed luciferase aggregates using human HSP70–HSP110 with human J-proteins JA2 (green), JB1 (blue), JA2+JB1 (magenta) or with no J-proteins (black) (n=3). c, Reactivation of heat-aggregated luciferase by nematode HSP70 machinery containing HSP-1, HSP-110 and either alone or in combination with the nematode J-proteins DNJ-12 (A) and DNJ-13 (B) (n=2). d, Fold change in trapped luciferase; control, GroELD87K without other chaperones (black). Values normalized to total 3H counts in each reaction (n=2). e, SEC profile after disaggregation/refolding (120 min) with either J-protein alone or combined. Elution fractions labelled F1–F4 (red lines); F4, disaggregated monomers (~63 kDa). f, Aggregate quantification for fractions F1–F4 from the SEC profile in e. Disappearance of 3H-luciferase from aggregates (F1–F3) occurs with concomitant accumulation of disaggregated monomer (F4). g, Aggregate quantification, after 40-min disaggregation. Values normalized to total counts in each reaction. Two-tailed t-test, **P<0.01, ***P<0.001 (n=3). Data are mean±s.e.m. Precise concentrations are shown in Extended Data Table 1.
Figure 2
Figure 2. Intermolecular JD–CTD interaction is required for mixed-class J-protein complex formation
a, Intermolecular cross-links (dashed lines) between Lys residues (orange) on JA2 (green) and JB1 (blue). b, JA2 and JB1 interactions analysed by FRET. Bars show donor quenching efficiency of JD–CTD interactions; cartoons below show fluorophore positions in J-protein protomer pairs 1–5. N-termini of JDJA2 and JDJB1 are labelled with acceptor fluorophore ReAsH. CTDJA2 and CTDJB1 are labelled with donor fluorophores FlAsH and Alexa Fluor 488 at residues 241 and 278, respectively (n=3). c, d, Ribbon diagrams showing representative positions of JDs on CTD dimers from docking simulations; cross-linked Lys residues (space filling, orange, connected with black dashed lines) established in a; HPD motif (stick representation, red). c, JDJB1 (blue) and CTDJA2 (green). d, JDJA2 (green) and CTDJB1 (blue). e, f, Competition of excess isolated JD fragments for classes A and B J-protein complex formation and effect on luciferase disaggregation. e, f, Protein disaggregation/refolding (e) and refolding-only (f) (n=3). Data are mean±s.e.m. Precise concentrations are shown in Extended Data Table 1.
Figure 3
Figure 3. Conserved electrostatic potential distributions in A and B J-protein classes are complementary and direct mixed-class J-protein interactions for complex formation
a, Electrostatic isopotential maps of CTD dimers comparing human (JA1, JA2, JB1 and JB4) and nematode (DNJ-12 and DNJ-13) class A and B J-proteins. Electrostatic potential around proteins is contoured at +1 (positive, cyan) and −1 (negative, red), kcal mol−1 e−1. Protein structures are represented by ribbon diagrams. b, Conserved α-helices and electrostatic isopotential maps contoured as in a of human and nematode J-domains. I–IV (from N-terminus) denote conserved α-helices. c, The J-domains of charge-reversal triple mutants (JA2RRR and JB1RRR); and their electrostatic isopotential maps compare with wild-types in b. RRR denotes triple amino acid substitutions D6R, E61R and E64R in JA2, and D4R, E69R and E70R in JB1. d, FRET determination of JA2 and JB1 triple charge-reversa; mutants (n=3). Bars show donor quenching efficiency of JD–CTD interactions; cartoons below show fluorophore positions in J-protein protomer pairs 1–4. Triple charge mutants are yellow. e, Luciferase disaggregation/refolding at 120 min with J-domain charge-reversal mutants (JA2: D6R (R); E61R+E64R (RR); D6R+E61R+E64R (RRR). JB1: D4R (R); E69R+E70R (RR); D4R+E69R+E70R (RRR)) (n=3). f, As in e, refolding-only at 80 min (n=3). Data are mean±s.e.m. Precise concentrations are shown in Extended Data Table 1.
Figure 4
Figure 4. Model of individual versus complexed class A and class B J-protein function in protein disaggregation
Size-specific aggregate targeting: large aggregates are targeted by J-proteinclass B–HSP70–HSP110 (blue); small aggregates are targeted by J-proteinclass A–HSP70–HSP110 (green); all aggregates sizes are targeted by J-protein-mixed-class-complex–HSP70–HSP110 (magenta).HSP70 molecules are in grey. Sequential reaction steps (encircled numbers): 1, J-protein targets aggregate; 2, J-protein recruits HSP70; 3, surface-bound chaperones generate pulling forces (dashed red arrows); and 4, polypeptide extraction leading to protein disaggregation. Chaperone recruitment denoted by dashed black arrows.

Comment in

References

    1. Hipp MS, Park SH, Hartl FU. Proteostasis impairment in protein-misfolding and -aggregation diseases. Trends Cell Biol. 2014;24:506–514. - PubMed
    1. Morimoto RI. Proteotoxic stress and inducible chaperone networks in neurodegenerative disease and aging. Genes Dev. 2008;22:1427–1438. - PMC - PubMed
    1. Kirstein-Miles J, Scior A, Deuerling E, Morimoto RI. The nascent polypeptide-associated complex is a key regulator of proteostasis. EMBO J. 2013;32:1451–1468. - PMC - PubMed
    1. Rampelt H, et al. Metazoan Hsp70 machines use Hsp110 to power protein disaggregation. EMBO J. 2012;31:4221–4235. - PMC - PubMed
    1. Goloubinoff P, Mogk A, Zvi AP, Tomoyasu T, Bukau B. Sequential mechanism of solubilization and refolding of stable protein aggregates by a bichaperone network. Proc. Natl Acad. Sci. USA. 1999;96:13732–13737. - PMC - PubMed

Publication types

MeSH terms

Substances