. 2015 Aug 7:15:191.
doi: 10.1186/s12870-015-0584-4.

Towards a scientific interpretation of the terroir concept: plasticity of the grape berry metabolome

Affiliations

Towards a scientific interpretation of the terroir concept: plasticity of the grape berry metabolome

Andrea Anesi et al. BMC Plant Biol. .

Abstract

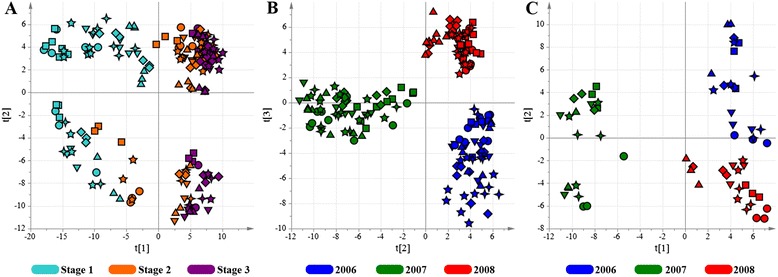
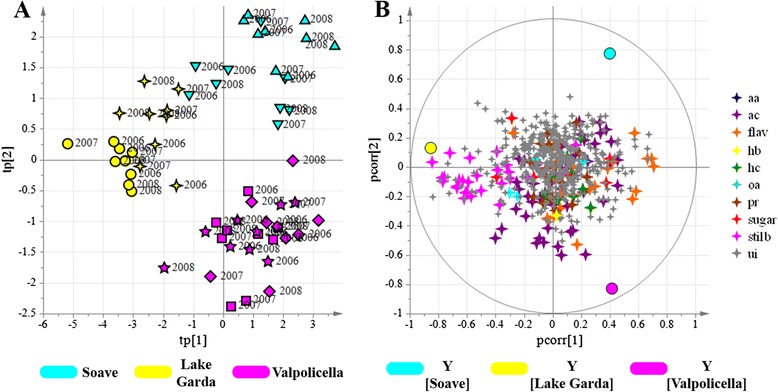
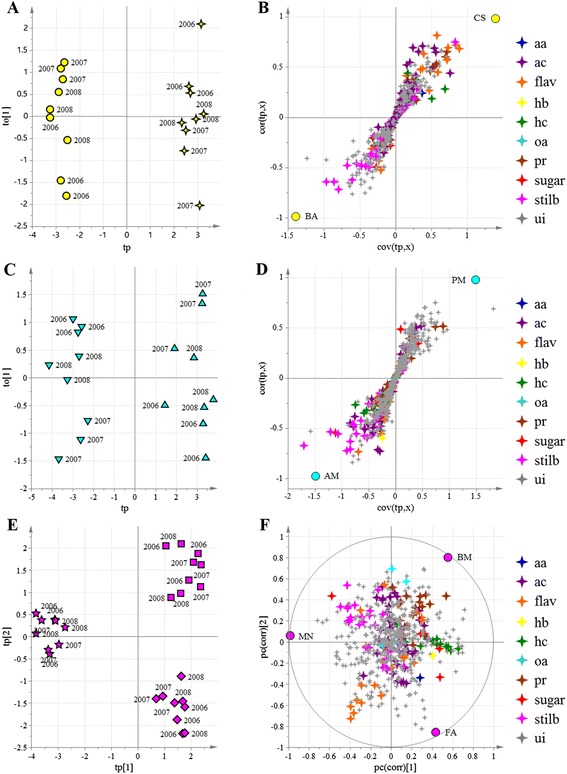
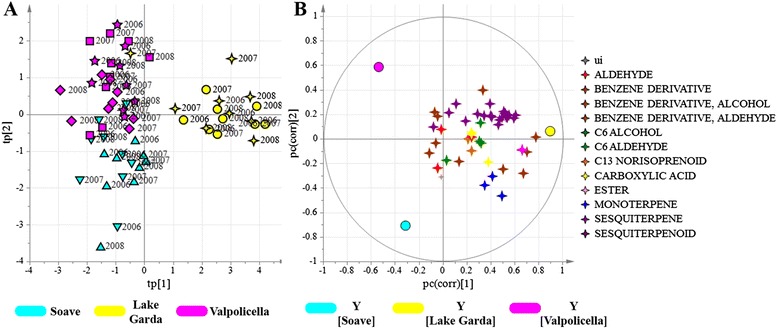
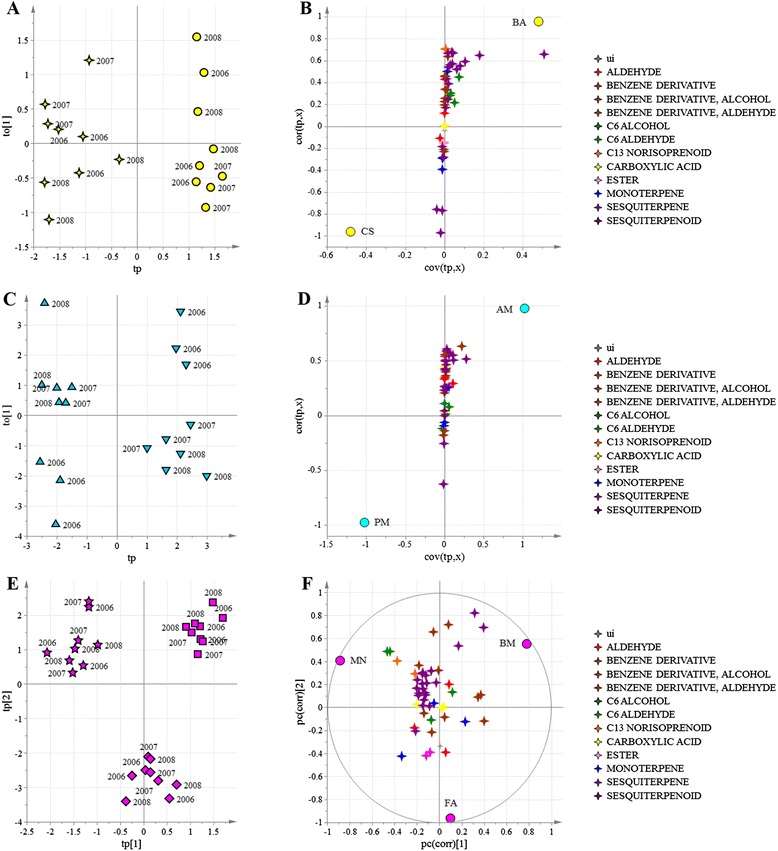
Background: The definition of the terroir concept is one of the most debated issues in oenology and viticulture. The dynamic interaction among diverse factors including the environment, the grapevine plant and the imposed viticultural techniques means that the wine produced in a given terroir is unique. However, there is an increasing interest to define and quantify the contribution of individual factors to a specific terroir objectively. Here, we characterized the metabolome and transcriptome of berries from a single clone of the Corvina variety cultivated in seven different vineyards, located in three macrozones, over a 3-year trial period.

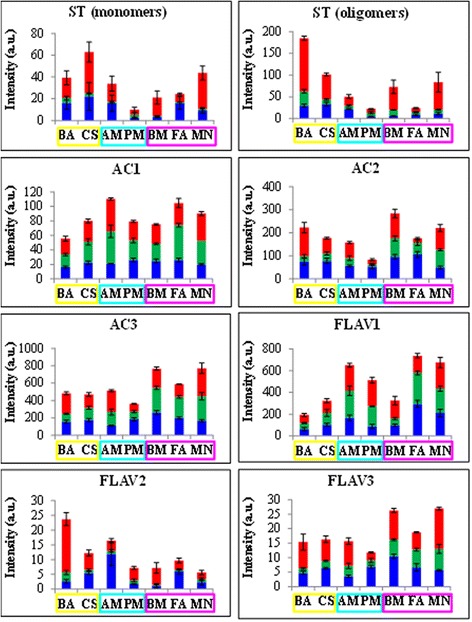
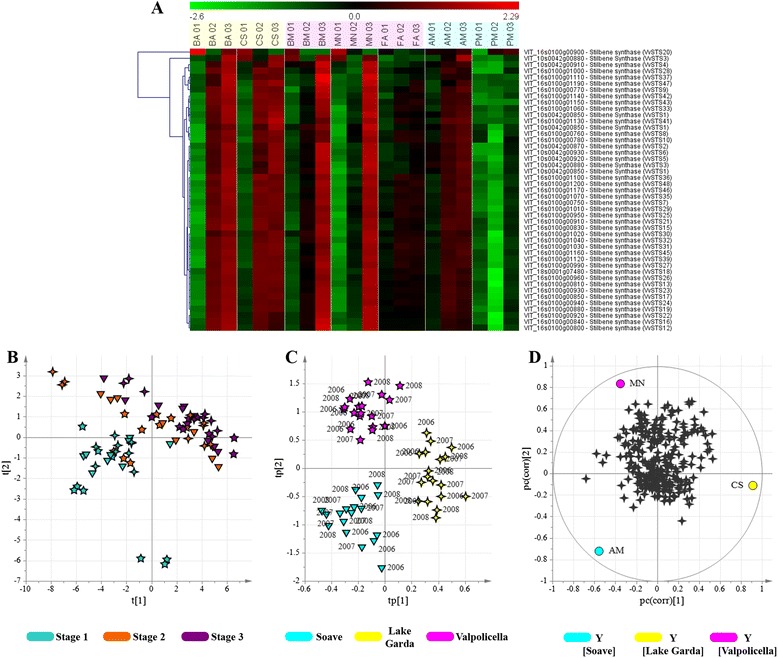
Results: To overcome the anticipated strong vintage effect, we developed statistical tools that allowed us to identify distinct terroir signatures in the metabolic composition of berries from each macrozone, and from different vineyards within each macrozone. We also identified non-volatile and volatile components of the metabolome which are more plastic and therefore respond differently to terroir diversity. We observed some relationships between the plasticity of the metabolome and transcriptome, allowing a multifaceted scientific interpretation of the terroir concept.

Conclusions: Our experiments with a single Corvina clone in different vineyards have revealed the existence of a clear terroir-specific effect on the transcriptome and metabolome which persists over several vintages and allows each vineyard to be characterized by the unique profile of specific metabolites.


Figures

Fig. 1
Fig. 1
PCA score scatter plot of the model obtained for the metabolites detected by HPLC-ESI-MS. Samples, corresponding to the seven vineyards (sampled in vintages 2006, 2007 and 2008 at three time points) are roughly separated according to developmental stage (a; explained variance equal to 44 %). Stage 1: beginning of véraison; stage 2: pre-ripening; stage 3: full maturity. PCA score scatter plot of the same data set used in (a) colored according to vintage (b; explained variance equal to 20 %). Blue: 2006; green: 2007; red: 2008. PCA score scatter plot of fully-ripe grapes (c; explained variance equal to 35 %). Blue: 2006; green: 2007; red: 2008. Vineyards: ▼ = AM; ● = BA; ◼ = BM; ✦ = CS; ♦ = FA; ★ = MN; ▲ = PM
Fig. 2
Fig. 2
oCPLS2-DA score scatter plot (a) and correlation loading plot (b) of the model for the metabolites detected by HPLC-ESI-MS. Samples, corresponding to seven grape vineyards at three developmental stages are separated according to the geographical macrozones, regardless of the vintage. Groups of metabolites are depicted in different colors. Vineyards: ▼ = AM; ● = BA; ◼ = BM; ✦ = CS; ♦ = FA; ★ = MN; ▲ = PM. aa = amino acid; ac = anthocyanin; flav = flavonoid; hb = hydroxybenzoic acid; hc = hydroxycinnamic acid; oa = organic acid; pr = procyanidin; s = sugar; st = stilbene and viniferin; ui = unidentified
Fig. 3
Fig. 3
Distribution of macrozone metabolic markers, determined by HPLC-MS analysis, among the individual vineyards and in all three vintages. The markers are listed in Additional file 9: Table S6 and are assigned to a chemical class and classified according to macrozone relevance, as shown in Additional file 10: Table S7. Blue bars = 2006 vintage; green bars = 2007 vintage; red bars = 2008 vintage. Yellow rectangle: Lake Garda macrozone; sky blue: Soave macrozone; fuchsia: Valpolicella macrozone. a.u. = arbitrary units
Fig. 4
Fig. 4
oCPLS2-DA models using the metabolites detected by HPLC-ESI-MS applied within each of the three geographical regions to distinguish the vineyards. For each model, the score scatter plot (a, c, e) and correlation loading plot (b, d, f) are provided. Samples, corresponding to seven vineyards at three developmental stages are separated regardless of the vintage. Vineyards: ▼ = AM; ● = BA; ◼ = BM; ✦ = CS; ♦ = FA; ★ = MN; ▲ = PM. Yellow (a, b): Lake Garda macrozone; sky blue (c, d): Soave macrozone; fuchsia (e, f): Valpolicella macrozone. Groups of metabolites are shown in different colors. aa = amino acid; ac = anthocyanin; flav = flavonoid; hb = hydroxybenzoic acid; hc = hydroxycinnamic acid; oa = organic acid; pr = procyanidin; s = sugar; st = stilbene and viniferin; ui = unidentified
Fig. 5
Fig. 5
oCPLS2-DA score plot (a) and correlation loading plot (b) using the volatile metabolites as X variables. Samples, corresponding to seven vineyards at three developmental stages are separated according to the geographical macrozones, regardless of the vintage. Groups of metabolites are shown in different colors. ui = unidentified. Vineyards: ▼ = AM; ● = BA; ◼ = BM; ✦ = CS; ♦ = FA; ★ = MN; ▲ = PM
Fig. 6
Fig. 6
oCPLS2-DA models using the volatile metabolites applied within each of the three geographical regions to distinguish the vineyards. For each model, the score scatter plot (a, c, e) and the correlation loading plot (b, d, f) are provided. Samples, corresponding to seven vineyards at three developmental stages are separated regardless of the vintage. Vineyards: ▼ = AM; ● = BA; ◼ = BM; ✦ = CS; ♦ = FA; ★ = MN; ▲ = PM. Yellow: Lake Garda macrozone (a, b); sky blue: Soave macrozone (c, d); fuchsia: Valpolicella macrozone (e, f). Groups of metabolites are shown in different colors. ui = unidentified
Fig. 7
Fig. 7
Grapevine berry transcriptome analysis. Heat map of the stilbene synthase gene family (VvSTSs) showing transcriptional profiles (a). The heat map was generated with TMeV v4.8.1 using the average expression level of the three replicates. Data were normalized based on the mean center genes/rows adjustment, and Pearson’s correlation was chosen as the statistical metric. PCA score scatter plot obtained using transcripts related to secondary metabolism (b; explained variance equal to 69 %). Stage 1: beginning of véraison; stage 2: pre-ripening; stage 3: full maturity. oCPLS2-DA score scatter plot (c) and correlation loading plot (d). Samples are separated according to the geographical macrozones, regardless of the vintage. Vineyards: ▼ = AM; ✦ = CS; ★ = MN. In (d) the circles represent the macrozone, while the ✦ symbols represent the transcripts

References

    1. Swiegers JH, Bartowsky EJ, Henschke PA, Pretorius IS. Yeast and bacterial modulation of wine aroma and flavour. Aust J Grape Wine Res. 2005;11(2):139–73. doi: 10.1111/j.1755-0238.2005.tb00285.x. - DOI
    1. Delfini C, Cocito C, Bonino M, Schellino R, Gaia P, Baiocchi C. Definitive evidence for the actual contribution of yeast in the transformation of neutral precursors of grape aromas. J Agric Food Chem. 2001;49(11):5397–408. doi: 10.1021/jf010613a. - DOI - PubMed
    1. Lund ST, Bohlmann J. The molecular basis for wine grape quality--a volatile subject. Science. 2006;311(5762):804–5. doi: 10.1126/science.1118962. - DOI - PubMed
    1. Iriti M, Faoro F. Grape phytochemicals: a bouquet of old and new nutraceuticals for human health. Med Hypotheses. 2006;67(4):833–8. doi: 10.1016/j.mehy.2006.03.049. - DOI - PubMed
    1. Mattivi F, Guzzon R, Vrhovsek U, Stefanini M, Velasco R. Metabolite profiling of grape: flavonols and anthocyanins. J Agric Food Chem. 2006;54(20):7692–702. doi: 10.1021/jf061538c. - DOI - PubMed

Publication types

Associated data