A spatial analysis of heat stress related emergency room visits in rural Southern Ontario during heat waves
- PMID: 26245846
- PMCID: PMC4527124
- DOI: 10.1186/s12873-015-0043-4
A spatial analysis of heat stress related emergency room visits in rural Southern Ontario during heat waves
Abstract
Background: In Southern Ontario, climate change may have given rise to an increasing occurrence of heat waves since the year 2000, which can cause heat stress to the general public, and potentially have detrimental health consequences. Heat waves are defined as three consecutive days with temperatures of 32 °C and above. Heat stress is the level of discomfort. A variety of heat stress indices have been proposed to measure heat stress (e.g., the heat stress index (HSI)), and has been shown to predict increases in morbidity and/or mortality rates in humans and other species. Maps visualizing the distribution of heat stress can provide information about related health risks and insight for control strategies. Information to inform heat wave preparedness models in Ontario was previously only available for major metropolitan areas.
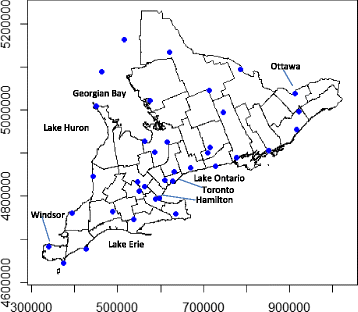
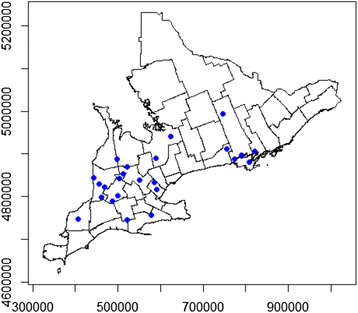
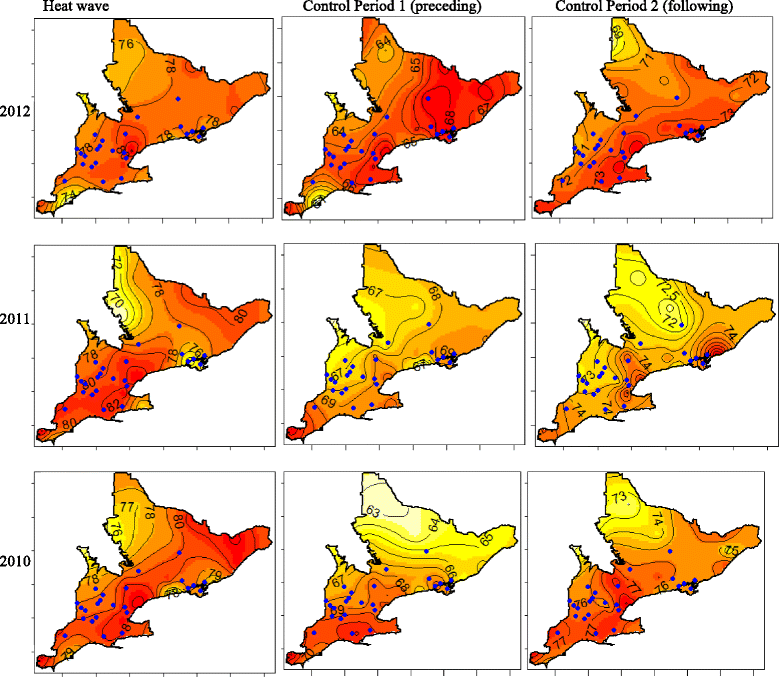
Methods: Hospitals in communities of fewer than 100,000 individuals were recruited for a pilot study by telephone. The number of people visiting the emergency room or 24-hour urgent care service was collected for a total of 27 days, covering three heat waves and six 3-day control periods from 2010-2012. The heat stress index was spatially predicted using data from 37 weather stations across Southern Ontario by geostatistical kriging. Poisson regression modeling was applied to determine the rate of increased number of emergency room visits in rural hospitals with respect to the HSI.
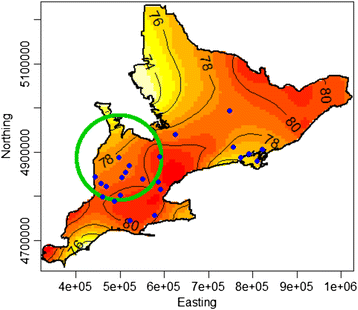
Results: During a heat wave, the average rate of emergency room visits was 1.11 times higher than during a control period (IRR = 1.11, CI95% (IRR) = (1.07,1.15), p ≤ 0.001). In a univariable model, HSI was not a significant predictor of emergency room visits, but when accounting for the confounding effect of a spatial trend polynomial in the hospital location coordinates, a one unit increase in HSI predicted an increase in daily emergency rooms visits by 0.4% (IRR = 1.004, CI95%(IRR) = (1.0005,1.007), p = 0.024) across the region. One high-risk cluster and no low risk clusters were identified in the southwestern portion of the study area by the spatial scan statistic during heat waves. The high-risk cluster is located in a region with high levels of heat stress during heat waves.
Conclusions: This finding will aid hospitals and rural public health units in preventing and preparing for emergencies of foreseeable heat waves. Future research is needed to assess the relation between heat stress and individual characteristics and demographics of rural communities in Ontario.
Figures


Similar articles
-
Heat stress related dairy cow mortality during heat waves and control periods in rural Southern Ontario from 2010-2012.BMC Vet Res. 2015 Nov 27;11:291. doi: 10.1186/s12917-015-0607-2. BMC Vet Res. 2015. PMID: 26610334 Free PMC article.
-
Mapping rural community and dairy cow heat stress in Southern Ontario: A common geographic pattern from 2010 to 2012.Arch Environ Occup Health. 2016 Jul 3;71(4):199-207. doi: 10.1080/19338244.2015.1058235. Epub 2015 Jun 11. Arch Environ Occup Health. 2016. PMID: 26067385
-
Heat Stress Illness Emergency Department Visits in National Environmental Public Health Tracking States, 2005-2010.J Community Health. 2016 Feb;41(1):57-69. doi: 10.1007/s10900-015-0064-7. J Community Health. 2016. PMID: 26205070 Free PMC article.
-
Heat stress and public health: a critical review.Annu Rev Public Health. 2008;29:41-55. doi: 10.1146/annurev.publhealth.29.020907.090843. Annu Rev Public Health. 2008. PMID: 18031221 Review.
-
[Health effects of heat waves].Ig Sanita Pubbl. 2008 Nov-Dec;64(6):735-72. Ig Sanita Pubbl. 2008. PMID: 19219085 Review. Italian.
Cited by
-
Establishing Heat Alert Thresholds for the Varied Climatic Regions of British Columbia, Canada.Int J Environ Res Public Health. 2018 Sep 19;15(9):2048. doi: 10.3390/ijerph15092048. Int J Environ Res Public Health. 2018. PMID: 30235814 Free PMC article.
-
A comparison of the effect of weather and climate on emergency department visitation in Roanoke and Charlottesville, Virginia.Environ Res. 2020 Dec;191:110065. doi: 10.1016/j.envres.2020.110065. Epub 2020 Aug 20. Environ Res. 2020. PMID: 32827524 Free PMC article.
-
Perennial disaster patterns in Central Europe since 2000 and implications for hospital preparedness planning - a cross-sectional analysis.Sci Rep. 2025 Jan 3;15(1):620. doi: 10.1038/s41598-024-84223-4. Sci Rep. 2025. PMID: 39753701 Free PMC article.
-
Impacts of compounding drought and heatwave events on child mental health: insights from a spatial clustering analysis.Discov Ment Health. 2024 Jan 2;4(1):1. doi: 10.1007/s44192-023-00055-0. Discov Ment Health. 2024. PMID: 38168712 Free PMC article.
-
Assessment of heat stress contributing factors in the indoor environment among vulnerable populations in Klang Valley using principal component analysis (PCA).Sci Rep. 2024 Jul 15;14(1):16265. doi: 10.1038/s41598-024-67110-w. Sci Rep. 2024. PMID: 39009671 Free PMC article.
References
-
- Bassil KL, Cole DC, Moineddin R, Craig AM, Lou WYW, Schwartz B, et al. Temporal and spatial variation of heat related illness using 911 medical dispatch data. J Environ Res. 2009;109:600–6. - PubMed
-
- Environment Canada. [http://climate.weather.gc.ca/].
Publication types
MeSH terms
LinkOut - more resources
Full Text Sources
Other Literature Sources
Medical

