

Justified granulation aided noninvasive liver fibrosis classification system
- PMID: 26245999
- PMCID: PMC4527306
- DOI: 10.1186/s12911-015-0181-3
Justified granulation aided noninvasive liver fibrosis classification system
Abstract
Background: According to the World Health Organization 130-150 million (according to WHO) of people globally are chronically infected with hepatitis C virus. The virus is responsible for chronic hepatitis that ultimately may cause liver cirrhosis and death. The disease is progressive, however antiviral treatment may slow down or stop its development. Therefore, it is important to estimate the severity of liver fibrosis for diagnostic, therapeutic and prognostic purposes. Liver biopsy provides a high accuracy diagnosis, however it is painful and invasive procedure. Recently, we witness an outburst of non-invasive tests (biological and physical ones) aiming to define severity of liver fibrosis, but commonly used FibroTest®, according to an independent research, in some cases may have accuracy lower than 50 %. In this paper a data mining and classification technique is proposed to determine the stage of liver fibrosis using easily accessible laboratory data.
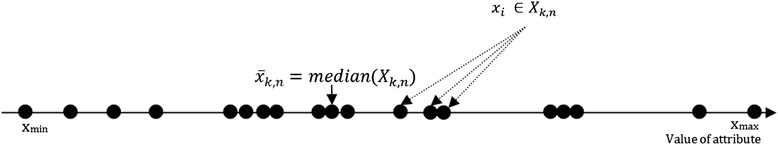
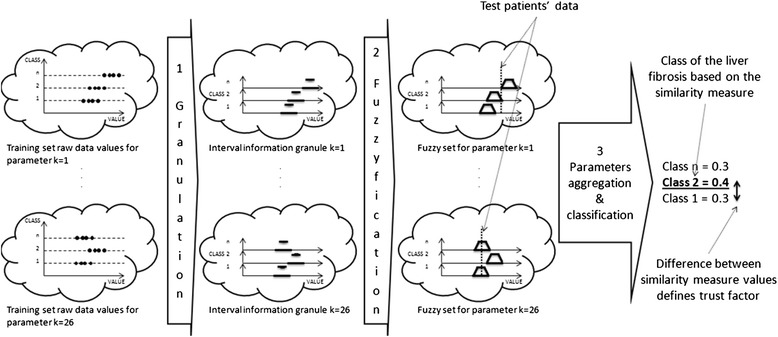
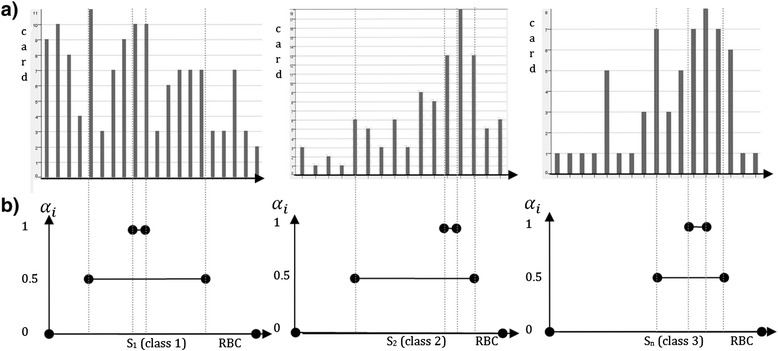
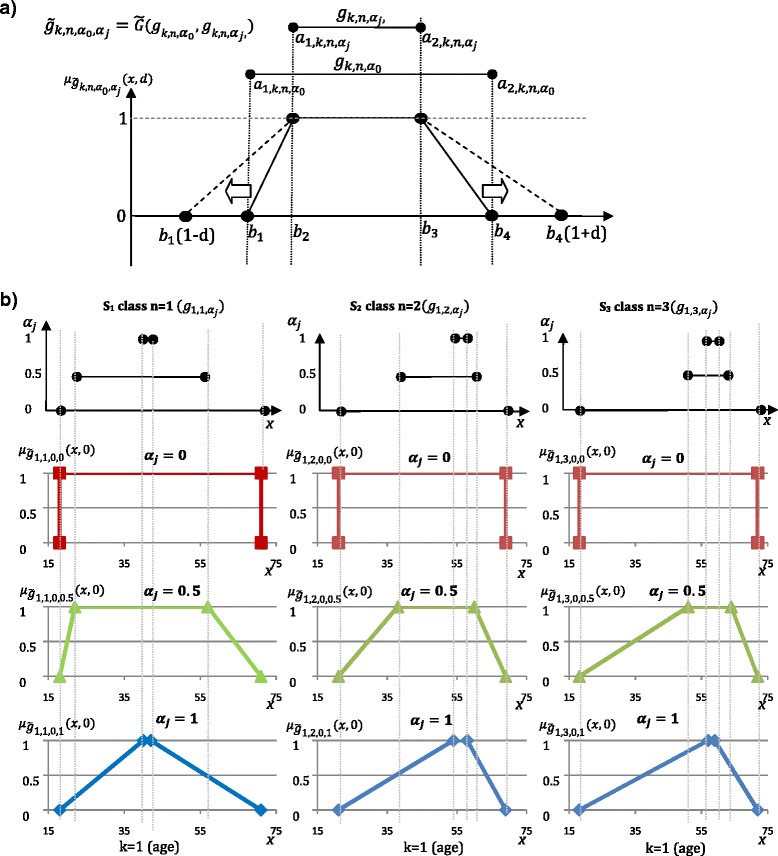
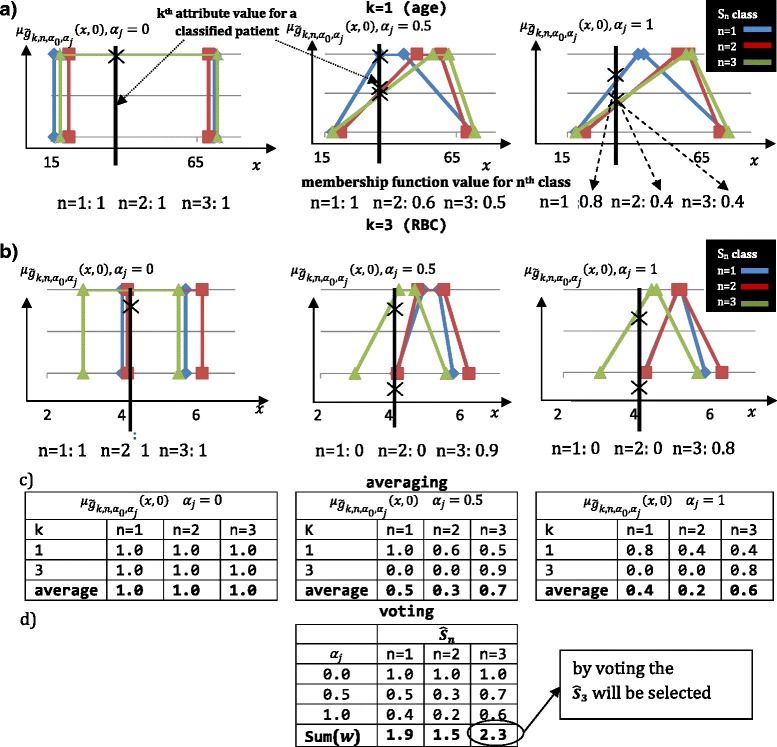
Methods: Research was carried out on archival records of routine laboratory blood tests (morphology, coagulation, biochemistry, protein electrophoresis) and histopathology records of liver biopsy as a reference value. As a result, the granular model was proposed, that contains a series of intervals representing influence of separate blood attributes on liver fibrosis stage. The model determines final diagnosis for a patient using aggregation method and voting procedure. The proposed solution is robust to missing or corrupted data.
Results: The results were obtained on data from 290 patients with hepatitis C virus collected over 6 years. The model has been validated using training and test data. The overall accuracy of the solution is equal to 67.9 %. The intermediate liver fibrosis stages are hard to distinguish, due to effectiveness of biopsy itself. Additionally, the method was verified against dataset obtained from 365 patients with liver disease of various etiologies. The model proved to be robust to new data. What is worth mentioning, the error rate in misclassification of the first stage and the last stage is below 6.5 % for all analyzed datasets.
Conclusions: The proposed system supports the physician and defines the stage of liver fibrosis in chronic hepatitis C. The biggest advantage of the solution is a human-centric approach using intervals, which can be verified by a specialist, before giving the final decision. Moreover, it is robust to missing data. The system can be used as a powerful support tool for diagnosis in real treatment.
Figures


References
-
- The reference of WHO organisation: http://www.who.int/mediacentre/factsheets/fs164/en/.
-
- Siemens Healthcare GmbH. Website. [http://www.healthcare.siemens.com/clinical-specialities/liver-disease/el...]
-
- BioPredictive. Website. [http://www.biopredictive.com/intl/physician/fibrotest-for-hcv]
Publication types
MeSH terms
LinkOut - more resources
Full Text Sources
Other Literature Sources
Medical
Research Materials
