

Concordance of absolute and relative plasma volume changes and stability of Fcells in routine hemodialysis
- PMID: 26246366
- PMCID: PMC4937455
- DOI: 10.1111/hdi.12338
Concordance of absolute and relative plasma volume changes and stability of Fcells in routine hemodialysis
Abstract
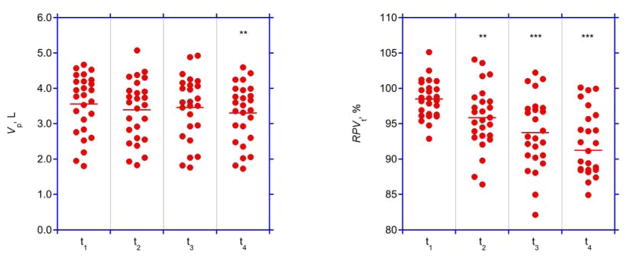
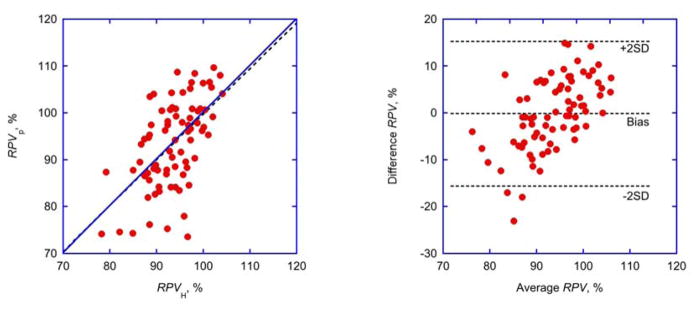
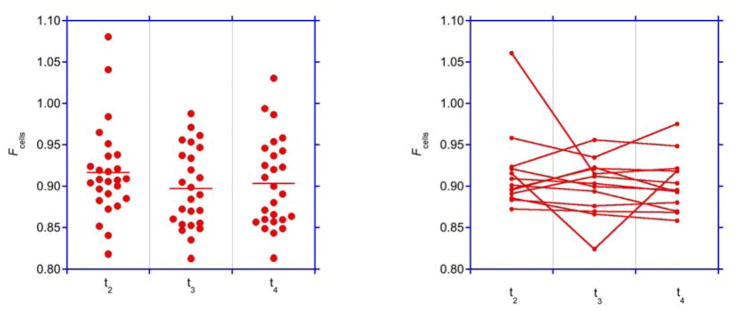
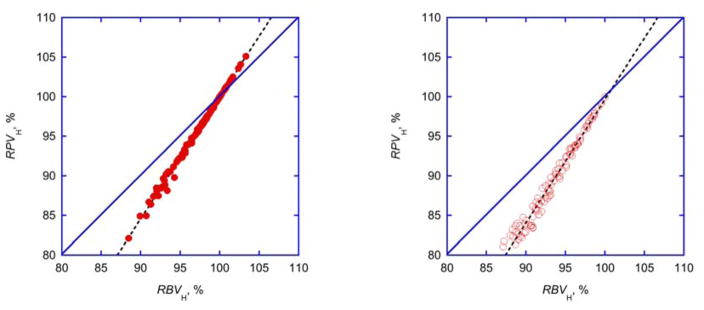
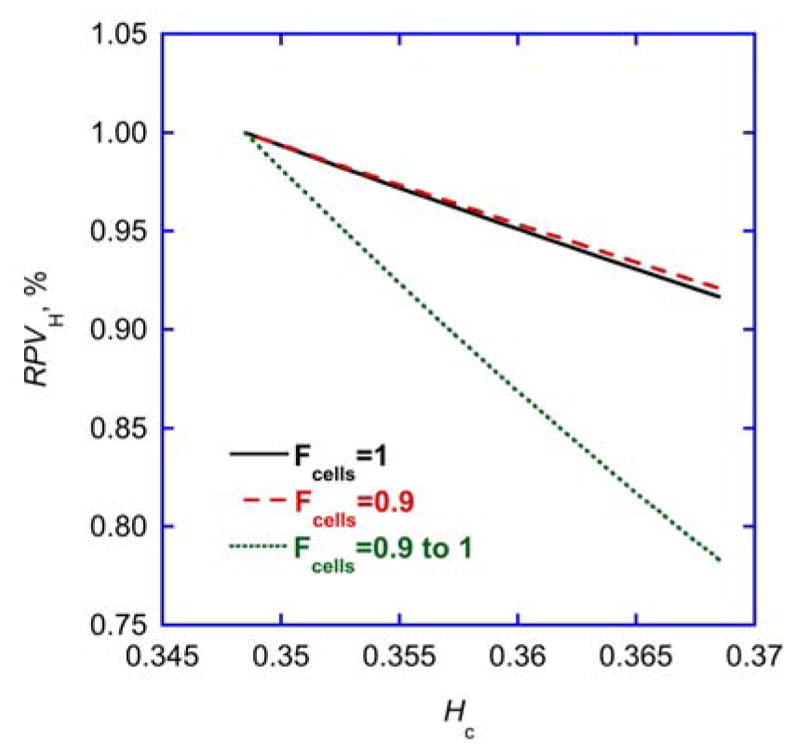
Central hematocrit (H) measurements are currently used to track the degree of ultrafiltration-induced hemoconcentration with the aim to detect and prevent excessive intravascular fluid depletion during hemodialysis (HD). Failure to maintain hemodynamic stability is commonly attributed to the misinterpretation of H caused by an unaccountable increase in Fcells , the ratio of whole-body hematocrit to H. It was the aim to examine Fcells under everyday conditions in a group of stable HD patients. Absolute plasma volume (Vp ) and H were concomitantly measured during routine HD in the extracorporeal system in hourly intervals by noninvasive and continuous technology (CritLine-Instrument-III) and indocyanine green dye dilution to derive relative plasma volumes from Vp and H (RPVp , RPVH ), respectively, and to calculate Fcells . Thirteen patients were studied during two midweek treatments (n = 26). Both absolute Vp (P < 0.05) and relative plasma volumes RPVH (P < 0.001) decreased during HD. Vp at any time point was positively correlated to RPVH (r = 0.52). Moreover, relative plasma volumes RPVH and RPVp determined by independent techniques were identical and showed negligible bias (-0.2%) but considerable limits of agreement (-15.6% to +15.3%). Fcells was stable and in the range of 0.9 ± 0.05 throughout HD and not different from the value assumed at the beginning of HD. Although Fcells remains constant in patients on routine dialysis and relative plasma volumes (RPVH and RPVp ) determined by independent techniques are therefore comparable, the variability of experimental conditions during dialysis and the limited accuracy of absolute volume measurements using available technology continues to complicate the ultrafiltration control problem.
Keywords: Ultrafiltration; hematocrit; monitoring; plasma volume.
© 2015 International Society for Hemodialysis.
Figures
References
-
- Schneditz D, Kenner T, Heimel H, Stabinger H. A sound speed sensor for the measurement of total protein concentration in disposable, blood perfused tubes. J Acoust Soc Am. 1989;86:2073–2080.
-
- Steuer RR, Harris DH, Conis JM. A new optical technique for monitoring hematocrit and circulating blood volume: Its application in renal dialysis. Dialysis & Transplant. 1993;22:260–265.
-
- Mancini E, Santoro A, Spongano M, Paolini F, Rossi M, Zucchelli P. Continuous on-line optical absorbance recording of blood volume changes during hemodialysis. Artif Organs. 1993;17(Aug):691–694. - PubMed
-
- Yoshida I, Ando K, Ando Y, Ookawara S, Suzuki M, Furuya H, et al. A new device to monitor blood volume in hemodialysis patients. Ther Apher Dial. 2010;14:560–565. - PubMed
-
- Paolini F, Bosetto A. Biofeedback systems architecture. Adv Ren Replace Ther. 1999;6:255–264. - PubMed
Publication types
MeSH terms
Grants and funding
LinkOut - more resources
Full Text Sources
Other Literature Sources
Medical
