. 2015 Aug 22;282(1813):20151053.
doi: 10.1098/rspb.2015.1053.

Fishing, fast growth and climate variability increase the risk of collapse

Affiliations

Fishing, fast growth and climate variability increase the risk of collapse

Malin L Pinsky et al. Proc Biol Sci. .

Abstract

Species around the world have suffered collapses, and a key question is why some populations are more vulnerable than others. Traditional conservation biology and evidence from terrestrial species suggest that slow-growing populations are most at risk, but interactions between climate variability and harvest dynamics may alter or even reverse this pattern. Here, we test this hypothesis globally. We use boosted regression trees to analyse the influences of harvesting, species traits and climate variability on the risk of collapse (decline below a fixed threshold) across 154 marine fish populations around the world. The most important factor explaining collapses was the magnitude of overfishing, while the duration of overfishing best explained long-term depletion. However, fast growth was the next most important risk factor. Fast-growing populations and those in variable environments were especially sensitive to overfishing, and the risk of collapse was more than tripled for fast-growing when compared with slow-growing species that experienced overfishing. We found little evidence that, in the absence of overfishing, climate variability or fast growth rates alone drove population collapse over the last six decades. Expanding efforts to rapidly adjust harvest pressure to account for climate-driven lows in productivity could help to avoid future collapses, particularly among fast-growing species.

Keywords: conservation; coupled social–ecological systems; cumulative impacts; ecosystem-based management; population dynamics.


Figures

Figure 1.
Figure 1.
Maps of large marine ecosystems (LMEs) showing global variation in (a) proportion of stocks that have ever collapsed, and (b) seasonal climatic variability (standard deviation of detrended monthly SSTs, °C). Grey regions in (a) indicate LMEs without stock status information. (Online version in colour.)
Figure 2.
Figure 2.
Plots of population characteristics against metrics of collapse and depletion. Violin plots (a–j) are for populations that ever collapsed (C) or did not (N). Scatter plots (k–t) are for the mean depletion (formula image) of each population. (Online version in colour.)
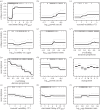
Figure 3.
Figure 3.
Partial dependence plots from the BRT models for the effects of the six most influential variables on stock collapse (a–f) and mean depletion (g–l). Black line shows the mean effect of each focal variable while controlling for the average effect of all other variables. The 95% CIs are in grey. Variables are shown in decreasing order of importance for collapse (a–f) and depletion (g–l). Management organizations in (i) correspond to Argentina (G), Australia (A), Canada (C), Europe (E), Multinational (M), New Zealand (N), South Africa (S) and the United States (U).
Figure 4.
Figure 4.
Interactions in BRT models explaining probability of collapse (a–c) or mean depletion (d–f), including (a) growth rate and maximum fishing, (b) seasonal variability and maximum fishing, (c) fecundity and maximum fishing, (d) overfishing (OF) duration and growth rate, (e) overfishing duration and trophic level and (f) maximum fishing and growth rate. Small dots show the location of data points. Interactions involving management (a categorical variable) are not plotted. (Online version in colour.)

References

    1. Pimm SL, Jenkins CN, Abell R, Brooks TM, Gittleman JL, Joppa LN, Raven PH, Roberts CM, Sexton JO. 2014. The biodiversity of species and their rates of extinction, distribution, and protection. Science 344, 987 (10.1126/science.1246752) - DOI - PubMed
    1. Fisher DO, Owens IPF. 2004. The comparative method in conservation biology. Trends Ecol. Evol. 19, 391–398. (10.1016/j.tree.2004.05.004) - DOI - PubMed
    1. Cardillo M, Mace GM, Jones KE, Bielby J, Bininda-Emonds ORP, Sechrest W, Orme CDL, Purvis A. 2005. Multiple causes of high extinction risk in large mammal species. Science 309, 1239–1241. (10.1126/science.1116030) - DOI - PubMed
    1. Lande R. 1993. Risks of population extinction from demographic and environmental stochasticity and random catastrophes. Am. Nat. 142, 911–927. (10.1086/285580) - DOI - PubMed
    1. Pinsky M, Jensen OP, Ricard D, Palumbi SR. 2011. Unexpected patterns of fisheries collapse in the world's oceans. Proc. Natl Acad. Sci. USA 108, 8317–8322. (10.1073/pnas.1015313108) - DOI - PMC - PubMed

Publication types