. 2015 Oct;89(20):10467-81.
doi: 10.1128/JVI.01541-15. Epub 2015 Aug 5.

Turnover Rate of NS3 Proteins Modulates Bluetongue Virus Replication Kinetics in a Host-Specific Manner

Affiliations

Turnover Rate of NS3 Proteins Modulates Bluetongue Virus Replication Kinetics in a Host-Specific Manner

Najate Ftaich et al. J Virol. 2015 Oct.

Abstract

Bluetongue virus (BTV) is an arbovirus transmitted to livestock by midges of the Culicoides family and is the etiological agent of a hemorrhagic disease in sheep and other ruminants. In mammalian cells, BTV particles are released primarily by virus-induced cell lysis, while in insect cells they bud from the plasma membrane and establish a persistent infection. BTV possesses a ten-segmented double-stranded RNA genome, and NS3 proteins are encoded by segment 10 (Seg-10). The viral nonstructural protein 3 (NS3) plays a key role in mediating BTV egress as well as in impeding the in vitro synthesis of type I interferon in mammalian cells. In this study, we asked whether genetically distant NS3 proteins can alter BTV-host interactions. Using a reverse genetics approach, we showed that, depending on the NS3 considered, BTV replication kinetics varied in mammals but not in insects. In particular, one of the NS3 proteins analyzed harbored a proline at position 24 that leads to its rapid intracellular decay in ovine but not in Culicoides cells and to the attenuation of BTV virulence in a mouse model of disease. Overall, our data reveal that the genetic variability of Seg-10/NS3 differentially modulates BTV replication kinetics in a host-specific manner and highlight the role of the host-specific variation in NS3 protein turnover rate.

Importance: BTV is the causative agent of a severe disease transmitted between ruminants by biting midges of Culicoides species. NS3, encoded by Seg-10 of the BTV genome, fulfills key roles in BTV infection. As Seg-10 sequences from various BTV strains display genetic variability, we assessed the impact of different Seg-10 and NS3 proteins on BTV infection and host interactions. In this study, we revealed that various Seg-10/NS3 proteins alter BTV replication kinetics in mammals but not in insects. Notably, we found that NS3 protein turnover may vary in ovine but not in Culicoides cells due to a single amino acid residue that, most likely, leads to rapid and host-dependent protein degradation. Overall, this study highlights that genetically distant BTV Seg-10/NS3 influence BTV biological properties in a host-specific manner and increases our understanding of how NS3 proteins contribute to the outcome of BTV infection.


Figures

FIG 1
FIG 1
Production and titration of Seg-10 BTV reassortant viruses by reverse genetics. (A) Seg-10 phylogenetic tree of different serotypes and strains of BTV. Sequences cluster into three major topotype groups, Western 1 and 2 and Eastern 1. The different Seg-10 selected for this study and their sequence references are indicated as BTV-1 (JX680466.1), BTV-2 (JN255931.1), and BTV-16 (FJ713328.1). The scale bar indicates the number of substitutions per site. (B) Strategy to produce, by reverse genetics, BTV reassortant viruses (rBTV/-1, rBTV/-2, and rBTV/-16) with the BTV-1 backbone (Seg-1 to -9) and a different Seg-10 (Seg-10/-1, Seg-10/-2, and Seg-10/-16). (C) Titers of viral stocks by RT-qPCR targeting the Seg-2 double-stranded RNA (dsRNA) of BTV-1. (D) Infectious titers of viral stocks by limiting-dilution assays on CPT-Tert cells. (E) Plaque assays of viral stocks on CPT-Tert cells. The diameters of the plaques (n > 70/virus) were measured in millimeters. The median values (Mdn), interquartile ranges (IQR), and significances (P < 10−6 by Wilcoxon rank-sum test) are indicated on the right side of the panel. Note that despite a similar infectious titer (≈5 × 10⁶ PFU/ml), rBTV/-2 induced smaller plaques than the two other Seg-10 reassortant viruses. Each of these experiments was repeated three times independently. Bars in panels C and D indicate standard errors.
FIG 2
FIG 2
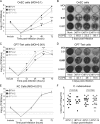
Seg-10/NS3 modulates BTV replication kinetics in ovine cells but not in Culicoides. Growth curve experiments were performed in OvEC (A), CPT-Tert (C), and KC Culicoides cells (E) with the three BTV Seg-10 reassortant viruses at the indicated MOI. Inocula and cell supernatants were collected from 0 h to 72 h p.i., and the viral titers were obtained by limiting-dilution assays in CPT-Tert cells. Each experiment was performed in triplicate, and bars indicate the standard errors. Dashed lines indicate the threshold of virus detection [1.5 log10 (TCID50/ml)]. Kruskal-Wallis statistical analyses were performed, and significance (compared to rBTV/-1 data) is presented: P < 0.05 (*), P < 0.01 (**), and P < 0.001 (***). Cytopathic effect assays in OvEC (B) and CPT-Tert (D) cells were performed with the three viruses at different MOI as indicated on the side of each panel. CPE was quantified at the most relevant MOI (indicated in boldface; e.g., 0.01 for OvEC and 0.001 for CPT-Tert) and expressed as the percentage of cell layer destroyed by each virus (% CPE). Each experiment was performed in triplicate. (F) C. nubeculosus females were intrathoracically injected with the different BTV Seg-10 reassortant viruses. Two sets of experiments (rBTV-1 versus rBTV-2 and rBTV-1 versus rBTV-16) were performed at least twice independently. At 5 days p.i., midges were individually homogenized and titrated by limiting-dilution assays in CPT-Tert cells. No significant difference was observed between the viral titers of the three Seg-10 reassortant viruses (P > 0.05 by Wilcoxon tests).
FIG 3
FIG 3
BTV Seg-10 reassortant viruses do not display differences of viral egress efficiency or Seg-10 RNA stability. (A) CPT-Tert cells were infected with rBTV/-1, rBTV/-2, and rBTV/-16 at an MOI of 0.001. At 18 h p.i., supernatants were collected and cells were disrupted by freeze-thawing. Intracellular and extracellular infectious titers were obtained by limiting-dilution assays in CPT-Tert cells [log10 (TCID50/ml)]. One-way ANOVA was performed, and significance (compared to rBTV/-1 data) is presented as P < 0.05 (*), P < 0.01 (**), and P < 0.001 (***). (B) Ratios of intracellular versus extracellular average viral titers were calculated for each BTV Seg-10 reassortant virus. Statistical analyses were performed with a Kruskal-Wallis test. No significant difference was observed in the intracellular/extracellular ratio of the titers in cells infected with the three Seg-10 BTV reassortants (P > 0.05). (C) CPT-Tert cells were infected at an MOI of 0.001. At 18 h p.i., BTV RNAs were extracted from the cells and the supernatants, and the intracellular and extracellular Seg-2 and Seg-10 RNA levels were estimated by RT-qPCR. One-way ANOVA was performed, and significance (compared to rBTV/-1 data) is presented as P < 0.05 (*) and P < 0.001 (***). (D) The intracellular Seg-2/Seg-10 average Cq value ratios were calculated for each BTV Seg-10 reassortant virus. Each experiment was performed in triplicate, and bars indicate standard errors. Statistical analyses were performed with a Kruskal-Wallis test. No significant difference was observed in the intracellular Seg-2/Seg-10 average Cq value ratios in cells infected with the three Seg-10 BTV reassortants (P > 0.05).
FIG 4
FIG 4
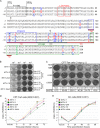
Role of NS3 amino acids in modulating BTV in vitro characteristics. (A) Alignment of NS3 protein sequences encoded by Seg-10 of BTV-1, -2, and -16. Interaction domains with calpactin (P11-BD) and BTV VP2 (VP2-BD) and the two late domains (L-Domains) and the viroporin-associated region are represented in boxes. The two transmembrane (TM) and the extracellular (EC) domains are also indicated. G, predicted glycosylation sites. The boldfaced and underlined amino acids in red are unique to one sequence, those in blue are common to two sequences, and those in green are the residues different among the three of them. (B) Infectious titers of viral stocks by limiting-dilution assays in CPT-Tert cells. Seg-10/-2 and Seg-10/-16 mutated to encode NS3 proteins with identical amino acid residues of Seg-10/-1 were used to produce by reverse genetics rBTV/-2AA and rBTV/-16AA, respectively. Representative pictures of plaque assays in CPT-Tert cells with the five BTV Seg-10 reassortant viruses are presented. The diameters of the plaques (n > 70/virus) were measured in millimeters. The median values (Mdn), interquartile ranges (IQR), and significance (P < 10−6 or P < 10−3 by Wilcoxon sum-of-rank test) are indicated on the right side of the panel. (C) Cytopathic effect assays in CPT-Tert cells were performed with the five viruses at the different MOI indicated on the side of each panel. CPE was quantified at the most relevant MOI (indicated in boldface; e.g., 0.01) and expressed as the percentage of cell layer destroyed by each virus (% CPE). Each experiment was performed in triplicate. (D and E) Growth curve experiments were performed in CPT-Tert cells (D) and KC Culicoides cells (E) with the five BTV Seg-10 reassortant viruses at the indicated MOI. Inocula and cell supernatants were collected from 0 h to 72 h (CPT-Tert) or 96 h (KC) p.i., and the viral titers were obtained by limiting-dilution assays in CPT-Tert cells. Each experiment was performed in triplicate, and bars indicate the standard errors. Dashed lines indicate the threshold of virus detection [1.5 log10 (TCID50/ml)]. Kruskal-Wallis statistical analyses were performed, and significance (compared to rBTV/-1 data) is presented as follows: P < 0.05 (*), P < 0.01 (**), and P < 0.001 (***).
FIG 5
FIG 5
Western blotting of NS3 proteins produced from the different BTV Seg-10 reassortant viruses. (A and B) Infectious assays with rBTV/-1, -2, -2AA, -16, and -16AA were performed in CPT-Tert (A) and KC (B) cells at the indicated MOI. Cells were collected at 18 h (CPT-Tert) and 5 days (KC) p.i. and analyzed by Western blotting with antisera raised against NS3, NS1, and α-tubulin as specified. NS3 and NS3a glycosylated forms are indicated as NS3-G and NS3a-G, respectively. An asterisk indicates a nonspecific band. Each experiment was performed three times independently, and representative blots are presented. (C) The proline residue at position 24 of NS3/NS3a encoded by Seg-10/-2 was changed by mutagenesis to a leucine to generate Seg-10/-2PL. CPT-Tert cells were transfected with 500 ng of the indicated Seg-10 (NS3) and BTV-1 Seg-5 (NS1) in vitro-transcribed RNAs. Twenty-four hours posttransfection, cells were collected and Western blot analyses were performed with the appropriate antisera as indicated in each panel. Note that this experiment was performed independently three times with two different sets of RNAs, and a representative blot is shown.
FIG 6
FIG 6
Low level of NS3 yielded by Seg-10/-2 is not related to the intracellular distribution of NS3, the translation efficiency, or the transactivation by NS1. (A) BSR cells were transfected with 500 ng of Seg-10 (NS3/NS3a) and the Seg-7 (VP7) or Seg-5 (NS1) in vitro-transcribed RNAs. Twenty-four hours posttransfection, cells were collected and Western blot analyses were performed with the appropriate antisera as indicated in each panel. Samples were loaded on separate blots with different exposure times to better appreciate NS3 protein levels under each condition. (i) NS1 protein was able to transactivate the NS3/NS3a translation of Seg-10/-1 and Seg-10/-2. (ii) Seg-10/-2 yielded less NS3/NS3a than Seg-10/-1 in the absence (Seg-7) or presence (Seg-5) of NS1 protein expression. An asterisk indicates nonspecific bands. NS3 and NS3a glycosylated forms are indicated as NS3-G and NS3a-G, respectively. Each experiment was performed independently in triplicate with two different sets of RNAs. (B) In vitro translation assays (HeLa lysates) were performed with 1 μg of Seg-10/-1 or Seg-10/-2 and 750 ng of BTV-1 Seg-7 in vitro-transcribed RNAs. Blots were incubated with the appropriate antisera as indicated in each panel. NS3 and NS3a glycosylated forms are indicated as NS3-G and NS3a-G, respectively. (C) CPT-Tert cells infected with rBTV/-1 and rBTV/-2 were analyzed by immunofluorescent assays at 22 h p.i. (i) The intracellular distribution of NS3 was scored as dispersed (Disp.) or concentrated (Conc.) using confocal microscopy. The scale bar represents 10 μm. (ii) The graph represents the number (percent) of cells in which the intracellular distribution of NS3 proteins displays a dispersed or concentrated staining pattern. At least 25 cells in random fields from two independent experiments were counted.
FIG 7
FIG 7
Effect of P24 on NS3/NS3a turnover rate and cellular protein degradation in ovine and Culicoides cells. (A and B) The CPT-Tert (A) and KC (B) cells were infected at an MOI of 0.1 with the indicated BTV Seg-10 reassortant viruses. Eighteen hours (CPT-Tert) or 48 h (KC) p.i., the cells were treated with cycloheximide (Cyclo) alone or in combination with MG132 (a proteasome and lysosome inhibitor). Cycloheximide-treated cells then were collected for Western blot analyses at 0 h (T0), 2 h (T2), and 4 h (T4) posttreatment, whereas cycloheximide- and MG132-treated cells were collected only at 4 h (T4) posttreatment. Western blotting of CPT-Tert and KC cell lysates infected with rBTV/-1 (i), -2 (ii), and -2PL (iii) using antisera raised against NS3, NS1, and α-tubulin, as indicated, are shown. NS3 and NS3a glycosylated forms are indicated as NS3-G and NS3a-G, respectively. An asterisk indicates nonspecific bands. A question mark indicates an unknown NS3-related protein that appeared at about 18 kDa in KC-infected cells treated with MG132. Signals of NS3a and NS1 proteins were quantified from three experiments using Image Lite Studio software, and the average values obtained are presented below each panel (% NS3a and % NS1). Values represent arbitrary units relative to the values of NS3a and NS1 signals at T0 (which were assigned a value of 100%). Representative blots from three independent experiments are shown. (iv) Dot plots represent the relative fold changes of NS3a levels upon MG132 treatment of CPT-Tert and KC cells infected with rBTV/-1, rBTV/-2, or rBTV/-2PL. Horizontal bars represent the mean values of the data obtained. Statistical analyses were performed by Kruskal-Wallis test. P values indicate a significant difference (P < 0.05) between NS3a fold change of rBTV/-2 and those of rBTV/-1 and rBTV/-2PL in CPT-Tert but not in KC cells.
FIG 8
FIG 8
Impact of P24 on BTV in vitro characteristics and virulence in IFNAR−/− mice. (A) Infectious titers of viral stocks by limiting-dilution assays in CPT-Tert cells. Seg-10/-2PL was used to produce rBTV/-2PL by reverse genetics. Representative pictures of plaque assays in CPT-Tert cells with the rBTV/-1, rBTV/-2, and rBTV/-2PL viruses are shown. The diameters of the plaques (n > 70/virus) were measured in millimeters. The median values (Mdn), interquartile ranges (IQR), and significance (P < 10−6 by Wilcoxon rank-sum test) are indicated on the right side of the panel. Note that rBTV/-2PL induced larger plaques than rBTV/-2. (B) Cytopathic effect assays in CPT-Tert cells were performed with the three Seg-10 reassortant viruses at different MOI as indicated on the side of each panel. CPE was quantified at the most relevant MOI (indicated in boldface; e.g., 0.01) and expressed as the percentage of cell layer destroyed by each virus (% CPE). Each experiment was performed in triplicate. (C) CPE assay supernatants (MOI, 0.001) were collected at 3 days p.i. and titrated by limiting dilution in CPT-Tert cells. The graph represents viral titers of each virus as indicated. Bars indicate the standard errors. One-way ANOVA was performed: *, P < 0.05; ***, P < 0.001. (D) Kaplan-Meier survival plots of IFNAR−/− mice (n ≥ 10) intraperitoneally inoculated with the indicated BTV Seg-10 reassortant viruses (10 PFU). Note that, unlike rBTV/-2, rBTV/-2PL killed 100% of the inoculated animals at 7 days p.i. (E) Graph representing the average Cq values of Seg-2 RNAs at 4 days p.i. with the three BTV Seg-10 reassortant viruses. Bars indicate the standard errors. One-way ANOVA was performed: ***, P < 0.001. (F) The presence of BTV VP7-specific antibodies in mock- and rBTV/-2-infected mice (n = 10 per condition) was detected by competition ELISAs 14 days p.i. The graph represents the frequency distribution of ELISA results (expressed as percentages of negativity) from serum samples of mock- or rBTV/-2-infected mice. Positive, doubtful, or negative were assigned according to the cutoff values recommended by the manufacturer (≤35%, positive; 35% to ≤45%, doubtful; >45%, negative).

Similar articles

Cited by

References

    1. Maclachlan NJ, Drew CP, Darpel KE, Worwa G. 2009. The pathology and pathogenesis of bluetongue. J Comp Pathol 141:1–16. doi:10.1016/j.jcpa.2009.04.003. - DOI - PubMed
    1. Schwartz-Cornil I, Mertens PP, Contreras V, Hemati B, Pascale F, Breard E, Mellor PS, MacLachlan NJ, Zientara S. 2008. Bluetongue virus: virology, pathogenesis and immunity. Vet Res 39:46. doi:10.1051/vetres:2008023. - DOI - PubMed
    1. DuToit RM. 1944. The transmission of blue-tongue and horse sickness by Culicoides. Onderstepoort J Vet Sci Anim Ind 19:7–16.
    1. Price DA, Hardy WT. 1954. Isolation of the bluetongue virus from Texas sheep-Culicoides shown to be a vector. J Am Vet Med Assoc 124:255–258. - PubMed
    1. Boorman J. 1986. Presence of bluetongue virus vectors on Rhodes. Vet Rec 118:21. doi:10.1136/vr.118.1.21. - DOI - PubMed

Publication types

MeSH terms

Substances