

Analysis of Phosphorylation-dependent Protein Interactions of Adhesion and Degranulation Promoting Adaptor Protein (ADAP) Reveals Novel Interaction Partners Required for Chemokine-directed T cell Migration
- PMID: 26246585
- PMCID: PMC4638039
- DOI: 10.1074/mcp.M115.048249
Analysis of Phosphorylation-dependent Protein Interactions of Adhesion and Degranulation Promoting Adaptor Protein (ADAP) Reveals Novel Interaction Partners Required for Chemokine-directed T cell Migration
Abstract
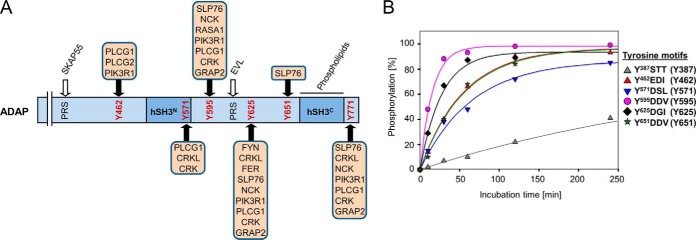
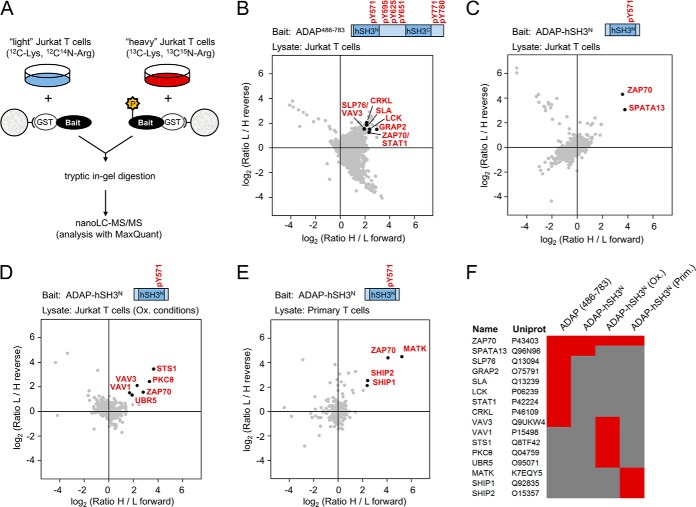
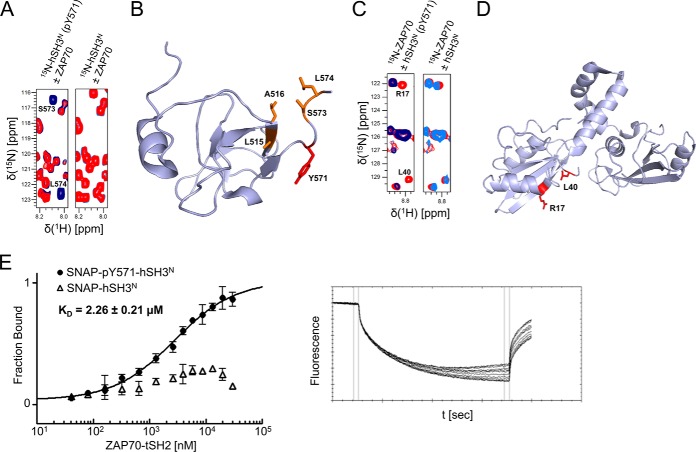
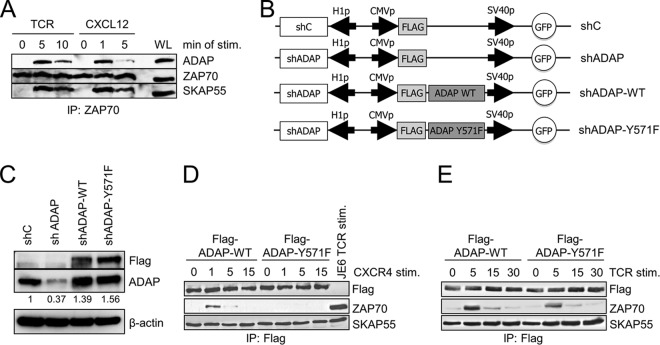
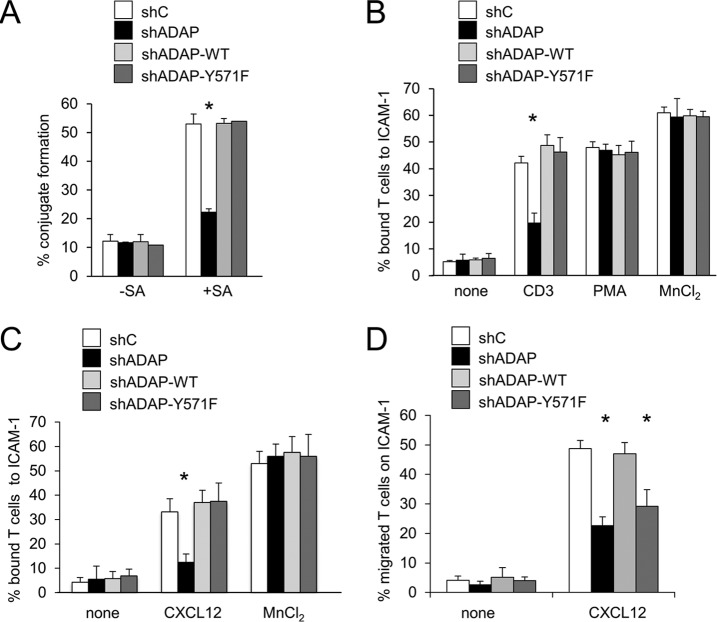
Stimulation of T cells leads to distinct changes of their adhesive and migratory properties. Signal propagation from activated receptors to integrins depends on scaffolding proteins such as the adhesion and degranulation promoting adaptor protein (ADAP)(1). Here we have comprehensively investigated the phosphotyrosine interactome of ADAP in T cells and define known and novel interaction partners of functional relevance. While most phosphosites reside in unstructured regions of the protein, thereby defining classical SH2 domain interaction sites for master regulators of T cell signaling such as SLP76, Fyn-kinase, and NCK, other binding events depend on structural context. Interaction proteomics using different ADAP constructs comprising most of the known phosphotyrosine motifs as well as the structured domains confirm that a distinct set of proteins is attracted by pY571 of ADAP, including the ζ-chain-associated protein kinase of 70 kDa (ZAP70). The interaction of ADAP and ZAP70 is inducible upon stimulation either of the T cell receptor (TCR) or by chemokine. NMR spectroscopy reveals that the N-terminal SH2 domains within a ZAP70-tandem-SH2 construct is the major site of interaction with phosphorylated ADAP-hSH3(N) and microscale thermophoresis (MST) indicates an intermediate binding affinity (Kd = 2.3 μm). Interestingly, although T cell receptor dependent events such as T cell/antigen presenting cell (APC) conjugate formation and adhesion are not affected by mutation of Y571, migration of T cells along a chemokine gradient is compromised. Thus, although most phospho-sites in ADAP are linked to T cell receptor related functions we have identified a unique phosphotyrosine that is solely required for chemokine induced T cell behavior.
© 2015 by The American Society for Biochemistry and Molecular Biology, Inc.
Figures
Similar articles
-
Adhesion and degranulation promoting adapter protein (ADAP) is a central hub for phosphotyrosine-mediated interactions in T cells.PLoS One. 2010 Jul 22;5(7):e11708. doi: 10.1371/journal.pone.0011708. PLoS One. 2010. PMID: 20661443 Free PMC article.
-
Identification of phosphorylation-dependent interaction partners of the adapter protein ADAP using quantitative mass spectrometry: SILAC vs (18)O-labeling.J Proteome Res. 2010 Aug 6;9(8):4113-22. doi: 10.1021/pr1003054. J Proteome Res. 2010. PMID: 20568816
-
SDF1α-induced interaction of the adapter proteins Nck and HS1 facilitates actin polymerization and migration in T cells.Eur J Immunol. 2015 Feb;45(2):551-61. doi: 10.1002/eji.201444473. Epub 2014 Nov 28. Eur J Immunol. 2015. PMID: 25359136
-
Tyrosine-phosphorylation of the scaffold protein ADAP and its role in T cell signaling.Expert Rev Proteomics. 2016 Jun;13(6):545-54. doi: 10.1080/14789450.2016.1187565. Expert Rev Proteomics. 2016. PMID: 27258783 Review.
-
ADAP-ting TCR signaling to integrins.Sci STKE. 2002 Apr 9;2002(127):re3. doi: 10.1126/stke.2002.127.re3. Sci STKE. 2002. PMID: 11943877 Review.
Cited by
-
Fluorescence Anisotropy and Polarization in the Characterization of Biomolecular Association Processes and Their Application to Study SH2 Domain Binding Affinity.Methods Mol Biol. 2023;2705:93-112. doi: 10.1007/978-1-0716-3393-9_6. Methods Mol Biol. 2023. PMID: 37668971
-
The SRC-family tyrosine kinase HCK shapes the landscape of SKAP2 interactome.Oncotarget. 2018 Feb 6;9(17):13102-13115. doi: 10.18632/oncotarget.24424. eCollection 2018 Mar 2. Oncotarget. 2018. PMID: 29568343 Free PMC article.
-
Epigenetic Insights Into Necrotizing Enterocolitis: Unraveling Methylation-Regulated Biomarkers.Inflammation. 2025 Feb;48(1):236-253. doi: 10.1007/s10753-024-02054-x. Epub 2024 May 30. Inflammation. 2025. PMID: 38814387 Free PMC article.
-
Enzymatic characterization and molecular mechanism of a novel aspartokinase mutant M372I/T379W from Corynebacterium pekinense.RSC Adv. 2019 Jul 9;9(37):21344-21354. doi: 10.1039/c9ra03293b. eCollection 2019 Jul 5. RSC Adv. 2019. PMID: 35521304 Free PMC article.
References
-
- Hogg N., Patzak I., and Willenbrock F. (2011) The insider's guide to leukocyte integrin signalling and function. Nat. Rev. Immunol. 11, 416–426 - PubMed
-
- Medeiros R. B., Burbach B. J., Mueller K. L., Srivastava R., Moon J. J., Highfill S., Peterson E. J., and Shimizu Y. (2007) Regulation of NF-kappaB activation in T cells via association of the adapter proteins ADAP and CARMA1. Science 316, 754–758 - PubMed
-
- Griffiths E. K., Krawczyk C., Kong Y. Y., Raab M., Hyduk S. J., Bouchard D., Chan V. S., Kozieradzki I., Oliveira-Dos-Santos A. J., Wakeham A., Ohashi P. S., Cybulsky M. I., Rudd C. E., and Penninger J. M. (2001) Positive regulation of T cell activation and integrin adhesion by the adapter Fyb/Slap. Science 293, 2260–2263 - PubMed
-
- Peterson E. J., Woods M. L., Dmowski S. A., Derimanov G., Jordan M. S., Wu J. N., Myung P. S., Liu Q. H., Pribila J. T., Freedman B. D., Shimizu Y., and Koretzky G. A. (2001) Coupling of the TCR to integrin activation by Slap-130/Fyb. Science 293, 2263–2265 - PubMed
Publication types
MeSH terms
Substances
Associated data
- Actions
- Actions
LinkOut - more resources
Full Text Sources
Molecular Biology Databases
Research Materials
Miscellaneous
