. 2014 Aug 1;2(4):343-358.
doi: 10.1007/s40336-014-0070-2.

The role of PET quantification in cardiovascular imaging

Affiliations

The role of PET quantification in cardiovascular imaging

Piotr Slomka et al. Clin Transl Imaging. .

Abstract

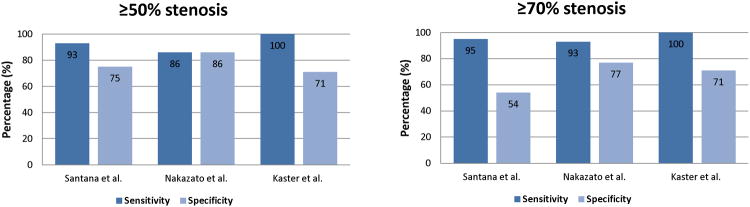
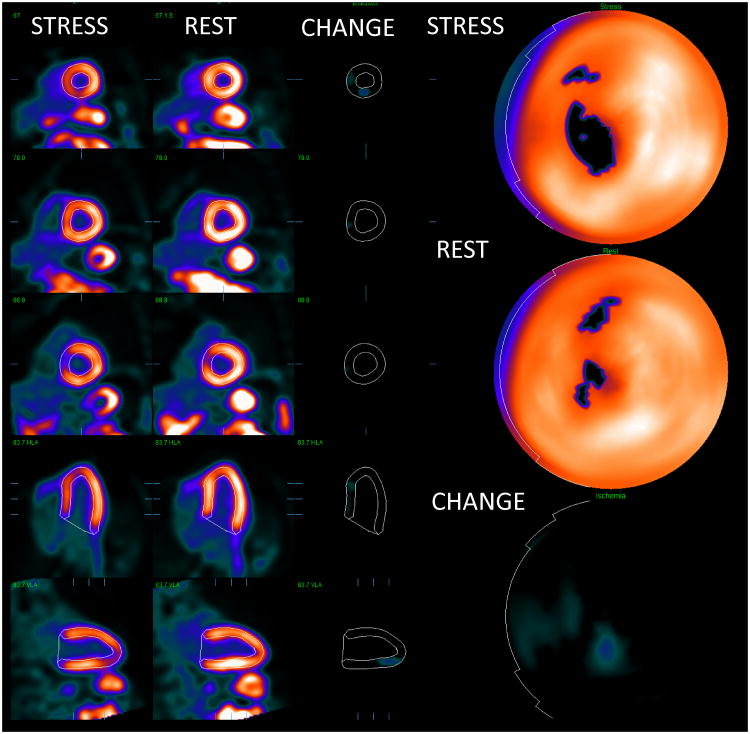
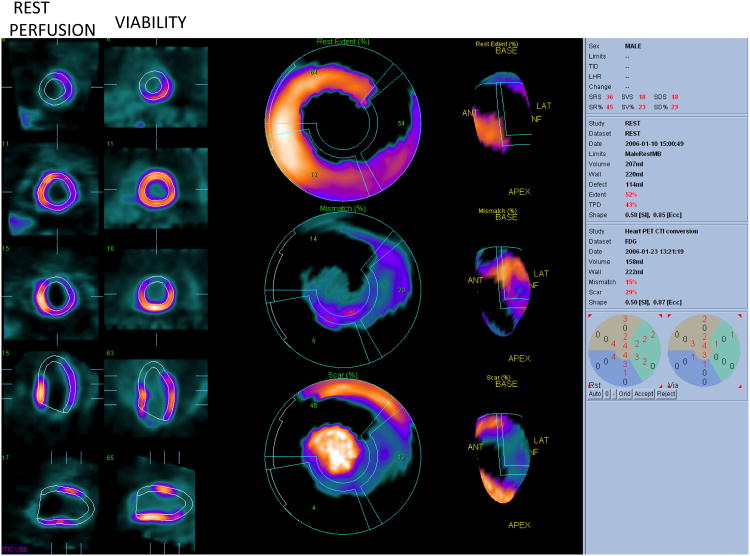
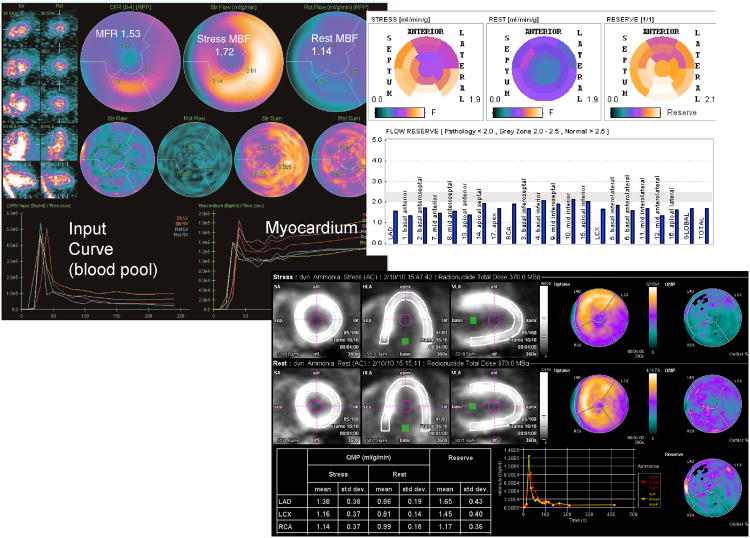
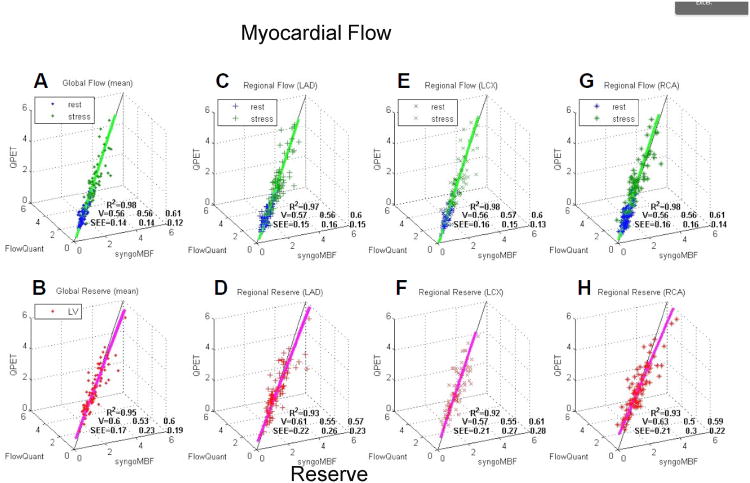
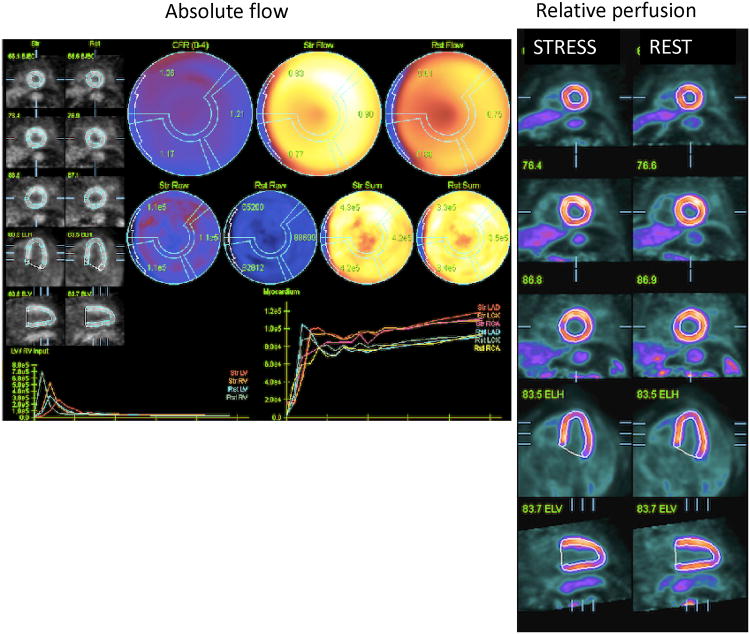
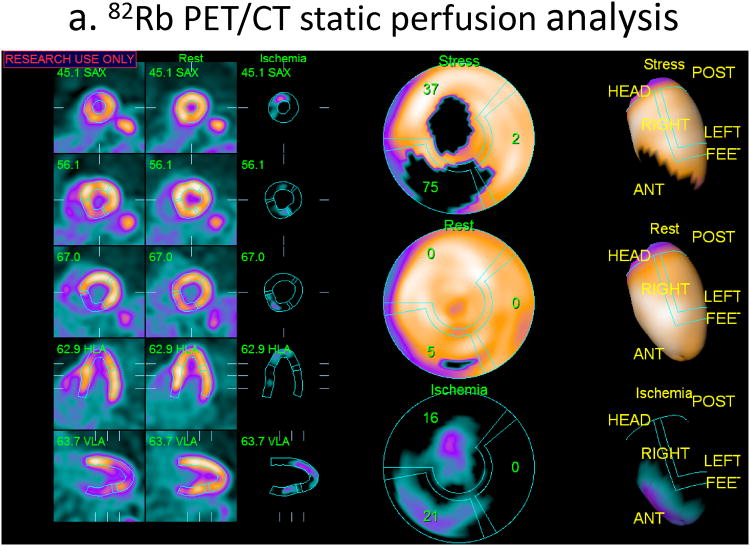
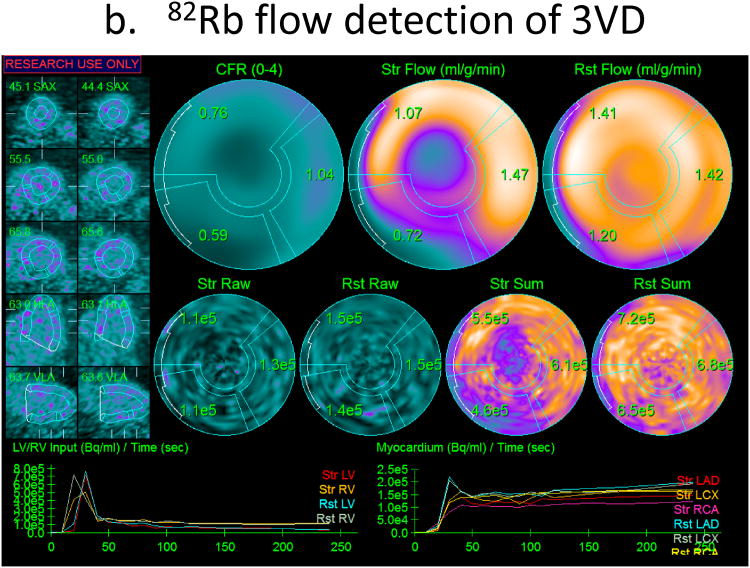
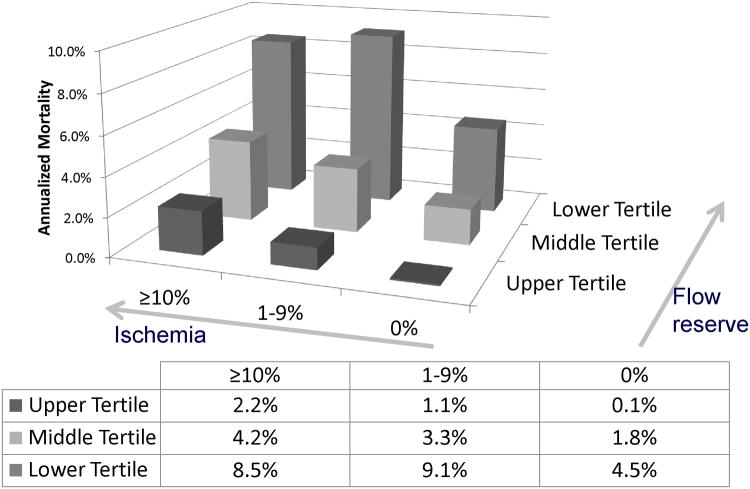
Positron Emission Tomography (PET) has several clinical and research applications in cardiovascular imaging. Myocardial perfusion imaging with PET allows accurate global and regional measurements of myocardial perfusion, myocardial blood flow and function at stress and rest in one exam. Simultaneous assessment of function and perfusion by PET with quantitative software is currently the routine practice. Combination of ejection fraction reserve with perfusion information may improve the identification of severe disease. The myocardial viability can be estimated by quantitative comparison of fluorodeoxyglucose (18FDG) and rest perfusion imaging. The myocardial blood flow and coronary flow reserve measurements are becoming routinely included in the clinical assessment due to enhanced dynamic imaging capabilities of the latest PET/CT scanners. Absolute flow measurements allow evaluation of the coronary microvascular dysfunction and provide additional prognostic and diagnostic information for coronary disease. Standard quantitative approaches to compute myocardial blood flow from kinetic PET data in automated and rapid fashion have been developed for 13N-ammonia, 15O-water and 82Rb radiotracers. The agreement between software methods available for such analysis is excellent. Relative quantification of 82Rb PET myocardial perfusion, based on comparisons to normal databases, demonstrates high performance for the detection of obstructive coronary disease. New tracers, such as 18F-flurpiridaz may allow further improvements in the disease detection. Computerized analysis of perfusion at stress and rest reduces the variability of the assessment as compared to visual analysis. PET quantification can be enhanced by precise coregistration with CT angiography. In emerging clinical applications, the potential to identify vulnerable plaques by quantification of atherosclerotic plaque uptake of 18FDG and 18F-sodium fluoride tracers in carotids, aorta and coronary arteries has been demonstrated.

Keywords: cardiac PET; cardiac function; coronary flow reserve; hybrid PET/CT; myocardial perfusion; myocardial perfusion flow; myocardial viability; quantification; vascular imaging; vulnerable plaque.


Conflict of interest statement

Compliance with Ethics Guidelines: Cedars-Sinai Medical Center receives royalties for the quantitative assessment of function, perfusion, and viability, a portion of which is distributed to some of the authors of this manuscript (DB, GG, PS). The authors declare that they have no conflict of interest. This article does not contain any studies with human or animal subjects performed by any of the authors.

Figures

Fig. 1
Fig. 1
Relative quantification accuracy. Results from three recent manuscripts by Santana et al. (3) (n=76), Nakazato et al. (4) (n=167), and Kaster et al.(8) (n=110), validating the use of relative quantification with normal limits for myocardial perfusion PET for detection of coronary artery disease by three separate software tools.
Fig. 2
Fig. 2
An example of relative quantification for myocardial perfusion PET. Co-registered stress and rest images with contours are shown on the left. The change images (CHANGE) in the middle show the ischemic region in the septal wall. Polar maps (right) shows corresponding significant defect on stress. The quantification results were stress TPD=10%, rest TPD=4%, ischemia by change analysis 5%. Ejection fraction was normal. This patient had significant > 70% lesion in the proximal LAD territory as confirmed by angiographic examination.
Fig. 3
Fig. 3
Viability quantification. Rest perfusion images and viability images are shown (2 right columns). Polar map quantification (middle column and 3D representation right column) shows resting perfusion defect with Total Perfusion deficit of 43% (top polar map) Mismatch of 15% (middle polar map) and scar of 29% (bottom polar map). Data courtesy Dr. Die Bondt.
Fig. 4
Fig. 4
Results from different implementations of the absolute flow quantification methods demonstrating regional and segmental quantification of rest and stress myocardial blood flow and coronary flow reserve (CFR). Cedars Sinai QPET (top left) PMOD software (top right) and Siemens syngoMBF flow analysis (bottom) are shown.
Fig. 5
Fig. 5
Agreement for the software packages on measurements of myocardial blood flow and coronary flow reserve (CFR). 3D scatterplots of syngoMBF vs. FlowQuant vs. QPET values of rest and stress myocardial blood flow and CFR (reserve) for global left ventricle (A and B) and regional vascular territories (C–H). R2 is total variance described by 3D unit basis vector (V) line of best fit. SEE is standard deviation of residual errors from regression line of best fit for each of the 3 programs. Reproduced with permission from De Kemp et al. (31).
Fig. 6
Fig. 6
Example of severely reduced coronary flow reserve (CFR) (1.17-1.37) and reduced stress flow (0.83-0.77 ml/g/min) in all vascular territories in a patient with syndrome × (left). This patient had borderline abnormal relative perfusion scan with mildly decreased uptake at stress in the part of the inferior wall (right).
Fig. 7
Fig. 7
Example of added value of myocardial flow reserve over ischemia quantification for diagnosis from 82Rb PET. Relative quantification of total perfusion deficit at stress and rest shows stress and ischemic abnormalities in left anterior descending (LAD) and left circumflex (LCX) territories but normal right coronary artery (RCA) territory (a), while myocardial flow reserve is definitely abnormal in all vascular territories (0.76-1.04), with no flow reserve (CFR=1.04) in the RCA region (b). This case was angiographically confirmed as triple vessel disease.
Fig. 7
Fig. 7
Example of added value of myocardial flow reserve over ischemia quantification for diagnosis from 82Rb PET. Relative quantification of total perfusion deficit at stress and rest shows stress and ischemic abnormalities in left anterior descending (LAD) and left circumflex (LCX) territories but normal right coronary artery (RCA) territory (a), while myocardial flow reserve is definitely abnormal in all vascular territories (0.76-1.04), with no flow reserve (CFR=1.04) in the RCA region (b). This case was angiographically confirmed as triple vessel disease.
Fig. 8
Fig. 8
Incremental prognostic value of coronary flow reserve (CFR) as compared to ischemia measures. Unadjusted annualized cardiac mortality by tertiles of CFR and by categories of myocardial ischemia. The annual rate of cardiac death increased with increasing summed stress score and decreasing CFR. Importantly, lower CFR consistently identified higher-risk patients at every level of myocardial scar/ischemia including among those with visually normal positron emission tomography scans and normal LV function. Reproduced with permission from Murthy et al. (41).
Fig. 9
Fig. 9
PET 18FDG coronary uptake quantification. Examples of increased 18FDG uptake at stent site in patients with acute ST elevation myocardial infarction (STEMI). (A) A 54-y-old man imaged after percutaneous coronary stenting of proximal left anterior descending artery (LAD) for STEMI. Quantification of maximum target-to background ratio (maxTBR) at stent site was 2.1 (white circles). (B) A 49-y-old man imaged after stenting of proximal RCA for STEMI. maxTBR at stent site was 2.1. Reproduced with permission from Cheng et al. (56).

References

    1. Klocke FJ, Baird MG, Lorell BH, et al. ACC/AHA/ASNC guidelines for the clinical use of cardiac radionuclide imaging--executive summary: a report of the American College of Cardiology/American Heart Association Task Force on Practice Guidelines (ACC/AHA/ASNC Committee to Revise the 1995 Guidelines for the Clinical Use of Cardiac Radionuclide Imaging) Circulation. 2003;108(11):1404–1418. - PubMed
    1. Sampson UK, Dorbala S, Limaye A, Kwong R, Di Carli MF. Diagnostic accuracy of rubidium-82 myocardial perfusion imaging with hybrid positron emission tomography/computed tomography in the detection of coronary artery disease. J Am Coll Cardiol. 2007 Mar 13;49(10):1052–1058. - PubMed
    1. Santana CA, Folks RD, Garcia EV, et al. Quantitative (82) Rb PET/CT: development and validation of myocardial perfusion database. J Nucl Med. 2007 Jul;48(7):1122–1128. - PubMed
    1. Nakazato R, Berman DS, Dey D, et al. Automated quantitative Rb-82 3D PET/CT myocardial perfusion imaging: normal limits and correlation with invasive coronary angiography. J Nucl Cardiol. 2012 Apr;19(2):265–276. - PMC - PubMed
    1. Arsanjani R, Xu Y, Hayes SW, et al. Comparison of fully automated computer analysis and visual scoring for detection of coronary artery disease from myocardial perfusion SPECT in a large population. J Nucl Med. 2013 Feb;54(2):221–228. - PMC - PubMed