. 2015 Sep;39(9):1619-31.
doi: 10.1111/acer.12808. Epub 2015 Aug 6.

Time-Dependent Effects of Ethanol on BK Channel Expression and Trafficking in Hippocampal Neurons

Affiliations

Time-Dependent Effects of Ethanol on BK Channel Expression and Trafficking in Hippocampal Neurons

Stephanie Palacio et al. Alcohol Clin Exp Res. 2015 Sep.

Abstract

Background: The large conductance Ca(2+) - and voltage-activated K(+) channel (BK) is an important player in molecular and behavioral alcohol tolerance. Trafficking and surface expression of ion channels contribute to the development of addictive behaviors. We have previously reported that internalization of the BK channel is a component of molecular tolerance to ethanol (EtOH).

Methods: Using primary cultures of hippocampal neurons, we combine total internal reflection fluorescence microscopy, electrophysiology, and biochemical techniques to explore how exposure to EtOH affects the expression and subcellular localization of endogenous BK channels over time.

Results: Exposure to EtOH changed the expression of endogenous BK channels in a time-dependent manner at the perimembrane area (plasma membrane and/or the area adjacent to it), while total protein levels of BK remain unchanged. These results suggest a redistribution of the channel within the neurons rather than changes in synthesis or degradation rates. Our results showed a temporally nonlinear effect of EtOH on perimembrane expression of BK. First, there was an increase in BK perimembrane expression after 10 minutes of EtOH exposure that remained evident after 3 hours, although not correlated to increases in functional channel expression. In contrast, after 6 hours of EtOH exposure, we observed a significant decrease in both BK perimembrane expression and functional channel expression. Furthermore, after 24 hours of EtOH exposure, perimembrane levels of BK had returned to baseline.

Conclusions: We report a complex time-dependent pattern in the effect of EtOH on BK channel trafficking, including successive increases and decreases in perimembrane expression and a reduction in active BK channels after 3 and 6 hours of EtOH exposure. Possible mechanisms underlying this multiphasic trafficking are discussed. As molecular tolerance necessarily underlies behavioral tolerance, the time-dependent alterations we see at the level of the channel may be relevant to the influence of drinking patterns on the development of behavioral tolerance.

Keywords: Alcohol; BK Channel; Ethanol; Hippocampus; Tolerance; Trafficking.


Figures

Figure 1
Figure 1
TIRF imaging of BK channels in hippocampal neurons. Representative TIRF images showing BK perimembrane expression in clusters and diffuse localization in hippocampal neurons. (A) Left: TIRF imaging of endogenous BK channels after immunofluorescence, right: GM1 staining showing the outline of the neuron. (B) Measurements of clusters. Left: higher magnification view of the boxed area in (A). Note the bright puncta (clusters) and diffuse staining, Right: binary image showing thresholding used for measuring clusters. (C) Histogram showing the size distribution of BK channel clusters (2618 clusters were quantified from 134 neurons).
Figure 2
Figure 2
Live cell imaging of BK-mGFP shows a similar distribution than endogenous BK channel in hippocampal neurons. Hippocampal neurons were transfected with a BK-mGFP construct. (A) Left: Transfected neuron shows GFP fluorescence in the cell body and processes. Right: Brightfield image of BK-mGFP-expressing neuron. (B) A higher magnification view of the boxed region in image A. The neuronal soma expressing BK-mGFP clearly shows a diffuse population and an aggregated bright puncta population similar to the endogenous staining of the BK channel. (C) Kymograph of bright puncta circled in image (B) which did not exhibit movement during the 5-minute long time-lapse. The time-lapse has an interval of 3 seconds between frames. (D) Measurements of clusters. Left: higher magnification view of image (B). Note the bright puncta (clusters) and diffuse staining, Right: binary image showing thresholding used for measuring clusters. (E) Histogram showing the size distribution of BK-mGFP channel clusters expressed in hippocampal neurons (858 clusters were quantified from 24 neurons).
Figure 3
Figure 3
Membrane intensity changes after time-dependent incubations with EtOH. Hippocampal neurons were incubated with EtOH for 10-min (control N=46, EtOH N=50 neurons), 3-hrs (control N=53, EtOH N=50 neurons), 6-hrs (control N=35, EtOH N=35 neurons) and 24-hrs (control N=47, EtOH N=48 neurons) and fixed and stained immediately afterwards. The graph shows the quantification of BK fluorescence intensity in the cell body after TIRF imaging. Values are shown as normalized fluorescence to the control group. P < 0.001, unpaired t-test to its own control group. Black lines with stars positioned over the columns show significant differences between EtOH treated groups, P < 0.001, one-way ANOVA followed by Bonferroni post hoc. Error bar is ±SEM.
Figure 4
Figure 4
Representative TIRF images showing time-dependent changes in BK perimembrane expression. Hippocampal neurons were incubated with EtOH for 10-min, 3-hrs, 6-hrs and 24-hrs and fixed and stained immediately afterwards. The left column shows the outline of the neurons via a membrane stain against GM1 (in the green channel). The center column shows representative TIRF images of hippocampal neurons after immunofluorescence against the BK channel (in the red channel). The right column shows pseudo-colored intensity profile displaying areas with higher fluorescence as yellow/white and with lower fluorescent signal as purple/black. All image are shown under the same parameters. Each row corresponds to a treatment. Scale bar = 10μm.
Figure 5
Figure 5
Cluster intensity changes after time-dependent incubations with EtOH. Hippocampal neurons were incubated with EtOH for 10-min, 3-hrs, 6-hrs or 24-hrs, and fixed and stained immediately against BK channel afterwards. Intensity of the clusters was quantified from TIRF images and values were pooled from many cells. Histograms showing changes in the distribution of the cluster fluorescence intensity after time-dependent EtOH incubations. Fluorescence intensity is shown as normalized values. Red (continuous line) is the size distribution of clusters in control cells and the blue (dashed line) is for the size distribution of clusters in EtOH treated cells. Note the shifts to the right meaning an increase in fluorescence intensity and shifts to the left indicating a reduction in fluorescence intensity. (A) 10-min EtOH (B) 3-hrs EtOH (C) 6-hrs EtOH (D) 24-hrs EtOH. Statistics between each control and EtOH pair showed that there is a significant effect after 10-min (control=732 clusters quantified from 46 neurons, EtOH=770 clusters quantified from 50 neurons), 3-hrs (control=890 clusters quantified from 53 neurons, EtOH=787 clusters quantified from 50 neurons), and 6-hrs (control=199 clusters quantified from 15 neurons, EtOH=194 clusters quantified from 16 neurons), of EtOH exposure (p < 0.0001, unpaired t-test), but not after 24-hrs (control=947 clusters quantified from 47 neurons, EtOH=996 clusters quantified from 48 neurons) of EtOH exposure (p >0.05, unpaired t-test).
Figure 6
Figure 6
Cluster size, # of cluster per area and % surface area do not change after time-dependent incubations with EtOH. Hippocampal neurons were incubated with EtOH for 10-min (control N=46, EtOH N=50 neurons), 3-hrs (control N=53, EtOH N=50 neurons), 6-hrs (control N=35, EtOH N=35 neurons) and 24-hrs (control N=47, EtOH N=48 neurons). Neurons were fixed and stained immediately against the BK channel afterwards. (A) Size of the clusters, (B) number of clusters per area unit and (C) % surface area were quantified for each cell imaged with TIRF microscopy. Values from EtOH treated cells were compared to their own control groups and no significant differences were found between pairs. Unpaired t-test, p > 0.05. Error bar is ±SEM.
Figure 7
Figure 7
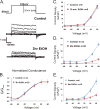
Changes in current density in response to EtOH exposure are time-dependent. (A) Representative macroscopic currents for untreated control and 3-hr EtOH treated hippocampal primary neurons obtained using the whole-cell configuration of the voltage-clamp technique. The neurons were held at hp=−60 mV, voltage steps were delta 20 mV to a final voltage of 100 mV. (B) Graph shows the normalized conductance of neurons with and without EtOH for 3-hrs. The V 1/2 for the untreated control was (−3.84 ± 3.53) mV; n=11, which was not statistically different from the EtOH 3-hrs V 1/2 (2.429 ± 2.74) mV; n=10 (p > 0.42, t-test). Normalized conductance was also measured for the 10-min and 6-hr treatments with a V 1/2 not significantly different from control (data not shown). Current density measurements obtained for 10-min (C), 3-hr (D), and 6-hr (E) 25mM EtOH exposure were obtained for voltages starting from −60 to 60 mV. Single channel conductance of the channel did not change, suggesting that the decrease in current density corresponds to a diminished number of functional channels in the plasma membrane. Error bars represent SEM, when not visible, they are contained within the point marker.
Figure 8
Figure 8
Total BK protein levels do not change after time-dependent incubations with EtOH. Hippocampal neurons were incubated with EtOH for 10-min (N=8), 3-hrs (N=6), 6-hrs (N=5) and 24-hrs (N=7). Cells were lysed immediately afterwards for Western blotting. (A) Representative immunoblots from a membrane labeled against the BK channel (green above) and GAPDH (red below). (B) Graph shows quantification of labeling against BK channel (normalized to GAPDH as loading control). EtOH values were normalized and compared to their own control groups. Values are shown as percent change from control average. Statistical analysis shows no significant difference between groups. One-way ANOVA, p > 0.05. Error bar is ±SEM.
Figure 9
Figure 9
The BK channel remains internalized after 6-hrs of EtOH exposure followed by 18-hrs of withdrawal. Hippocampal neurons were incubated with EtOH for 6-hrs, washed and left in withdrawal 18-hrs. Neurons were fixed (or lysed for Western blot) and stained immediately against the BK channel afterwards. (A) Representative images showing a reduction in BK perimembrane expression after 6-hrs of EtOH exposure plus 18-hrs of withdrawal when compared to control. Scale bar = 10μm (B) Representative blots showing no change in total levels of BK protein expression in neurons after 6-hrs of EtOH exposure plus 18-hrs of withdrawal when compared to control. (C) Perimembrane expression of the BK channel quantified after TIRF imaging is significantly reduced after EtOH exposure followed by withdrawal when compared to control, unpaired t-test, p < 0.01. Error bar is ±SEM, (control N=26, EtOH N=29 neurons) (D) Total BK channel protein levels quantified via Western blot show not significant difference when compared to control group, unpaired t-test, p > 0.05 (N=4).
Figure 10
Figure 10
Model: time-dependent changes in BK expression and trafficking after exposure to EtOH in hippocampal neurons. Under basal conditions the BK channel resides in the plasma membrane in two populations: clustered and diffuse. The clustered channels are almost exclusively associated with sub-surface cisternae of the endoplasmic reticulum. Moreover, there is a pool of intracellular BK in the cell body which is in balance with the BK channels at the surface through a regulated trafficking process. Upon EtOH exposure there is a rapid increase in perimembrane expression, possibly a translocation of the intracellular pool to the surface, which shifts the balance towards insertion of the channel. BK channels are inserted into clustered and non-clustered areas, therefore both populations have an increase in BK channel perimembrane expression. The increase in BK perimembrane expression observed after 10-min of EtOH is maintained for up to 3-hrs of EtOH exposure. However, after 6-hrs of EtOH exposure there is a drastic shift in trafficking that now favors the internalization of the channel, reducing BK channel surface expression significantly below basal levels. If the exposure to EtOH is maintained up to 24-hrs there again is a shift in balance towards insertion of the BK channel, which returns BK channel perimembrane levels to baseline. This process also takes place in both clustered and diffuse populations.

Similar articles

Cited by

References

    1. Ahmed SH, Koob GF. Transition from moderate to excessive drug intake: change in hedonic set point. Science (New York, NY) 1998;282(5387):298–300. - PubMed
    1. Axelrod D. Total Internal Reflection Fluorescence Microscopy in Cell Biology. Traffic. 2001;2(11):764–774. doi: 10.1034/j.1600-0854.2001.21104.x. - DOI - PubMed
    1. Bezzerides VJ, Ramsey IS, Kotecha S, Greka A, Clapham DE. Rapid vesicular translocation and insertion of TRP channels. Nature Cell Biology. 2004;6(8):709–20. doi: 10.1038/ncb1150. - DOI - PubMed
    1. Braithwaite SP, Xia H, Malenka RC. Differential roles for NSF and GRIP/ABP in AMPA receptor cycling. Proceedings of the National Academy of Sciences of the United States of America. 2002;99(10):7096–101. doi: 10.1073/pnas.102156099. - DOI - PMC - PubMed
    1. Carlson SL, Kumar S, Werner DF, Comerford CE, Morrow AL. Ethanol activation of protein kinase A regulates GABAA α1 receptor function and trafficking in cultured cerebral cortical neurons. The Journal of Pharmacology and Experimental Therapeutics. 2013;345(2):317–25. doi: 10.1124/jpet.112.201954. - DOI - PMC - PubMed

Publication types

Substances

Associated data