

Alcohol-Impaired Driving Among Adults - United States, 2012
- PMID: 26247434
- PMCID: PMC5779582
- DOI: 10.15585/mmwr.mm6430a2
Alcohol-Impaired Driving Among Adults - United States, 2012
Abstract
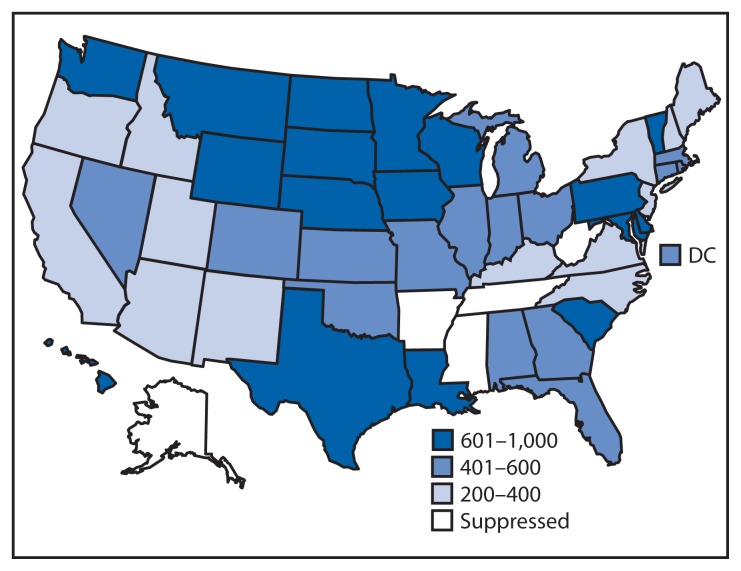
Alcohol-impaired driving crashes account for approximately one third of all crash fatalities in the United States. In 2013, 10,076 persons died in crashes in which at least one driver had a blood alcohol concentration (BAC) ≥0.08 grams per deciliter (g/dL), the legal limit for adult drivers in the United States. To estimate the prevalence, number of episodes, and annual rate of alcohol-impaired driving, CDC analyzed self-reported data from the 2012 Behavioral Risk Factor Surveillance System (BRFSS) survey. An estimated 4.2 million adults reported at least one alcohol-impaired driving episode in the preceding 30 days, resulting in an estimated 121 million episodes and a national rate of 505 episodes per 1,000 population annually. Alcohol-impaired driving rates varied by more than fourfold among states, and were highest in the Midwest U.S. Census region. Men accounted for 80% of episodes, with young men aged 21-34 years accounting for 32% of all episodes. Additionally, 85% of alcohol-impaired driving episodes were reported by persons who also reported binge drinking, and the 4% of the adult population who reported binge drinking at least four times per month accounted for 61% of all alcohol-impaired driving episodes. Effective strategies to reduce alcohol-impaired driving include publicized sobriety checkpoints, enforcement of 0.08 g/dL BAC laws, requiring alcohol ignition interlocks for everyone convicted of driving while intoxicated, and increasing alcohol taxes.
Figures
References
-
- National Highway Traffic Safety Administration. Traffic safety facts 2012: a compilation of motor vehicle crash data from the Fatality Analysis Reporting System and the General Estimates System. Washington, DC: US Department of Transportation, National Highway Traffic Safety Administration; 2014. Available at http://www-nrd.nhtsa.dot.gov/Pubs/812032.pdf.
-
- National Highway Traffic Safety Administration. Traffic safety facts 2013: alcohol-impaired driving. Washington, DC: US Department of Transportation, National Highway Traffic Safety Administration; 2014. Available at http://www-nrd.nhtsa.dot.gov/Pubs/812102.pdf.
-
- The Guide to Community Preventive Services. Motor vehicle-related injury prevention: reducing alcohol-impaired driving. Available at http://www.thecommunityguide.org/mvoi/AID/index.html.
-
- The Guide to Community Preventive Services. Preventing excessive alcohol consumption: increasing alcohol taxes. Available at http://www.thecommunityguide.org/alcohol/increasingtaxes.html.
-
- CDC. Behavioral Risk Factor Surveillance System. Atlanta, GA: US Department of Health and Human Services, CDC; Available at http://www.cdc.gov/brfss/
MeSH terms
LinkOut - more resources
Full Text Sources
