

Raman Spectroscopy of Optically Trapped Single Biological Micro-Particles
- PMID: 26247952
- PMCID: PMC4570358
- DOI: 10.3390/s150819021
Raman Spectroscopy of Optically Trapped Single Biological Micro-Particles
Abstract
The combination of optical trapping with Raman spectroscopy provides a powerful method for the study, characterization, and identification of biological micro-particles. In essence, optical trapping helps to overcome the limitation imposed by the relative inefficiency of the Raman scattering process. This allows Raman spectroscopy to be applied to individual biological particles in air and in liquid, providing the potential for particle identification with high specificity, longitudinal studies of changes in particle composition, and characterization of the heterogeneity of individual particles in a population. In this review, we introduce the techniques used to integrate Raman spectroscopy with optical trapping in order to study individual biological particles in liquid and air. We then provide an overview of some of the most promising applications of this technique, highlighting the unique types of measurements enabled by the combination of Raman spectroscopy with optical trapping. Finally, we present a brief discussion of future research directions in the field.
Keywords: Raman spectroscopy; bioaerosols; optical trapping.
Figures

Similar articles
-
A Collection of Molecular Fingerprints of Single Aerosol Particles in Air for Potential Identification and Detection Using Optical Trapping-Raman Spectroscopy.Molecules. 2022 Sep 14;27(18):5966. doi: 10.3390/molecules27185966. Molecules. 2022. PMID: 36144702 Free PMC article.
-
Recent advances in laser tweezers Raman spectroscopy (LTRS) for label-free analysis of single cells.J Biophotonics. 2013 Jan;6(1):36-48. doi: 10.1002/jbio.201200143. Epub 2012 Nov 23. J Biophotonics. 2013. PMID: 23175434 Review.
-
Laser Tweezers Raman Microspectroscopy of Single Cells and Biological Particles.Methods Mol Biol. 2018;1745:219-257. doi: 10.1007/978-1-4939-7680-5_13. Methods Mol Biol. 2018. PMID: 29476472
-
Confocal Raman microscopy for investigating synthesis and characterization of individual optically trapped vinyl-polymerized surfactant particles.Appl Spectrosc. 2014;68(6):633-41. doi: 10.1366/13-07337. Appl Spectrosc. 2014. PMID: 25014718
-
Raman tweezers and their application to the study of singly trapped eukaryotic cells.Integr Biol (Camb). 2009 Jan;1(1):43-52. doi: 10.1039/b815253e. Epub 2008 Nov 19. Integr Biol (Camb). 2009. PMID: 20023790 Review.
Cited by
-
A Collection of Molecular Fingerprints of Single Aerosol Particles in Air for Potential Identification and Detection Using Optical Trapping-Raman Spectroscopy.Molecules. 2022 Sep 14;27(18):5966. doi: 10.3390/molecules27185966. Molecules. 2022. PMID: 36144702 Free PMC article.
-
Microfluidic Cultivation and Laser Tweezers Raman Spectroscopy of E. coli under Antibiotic Stress.Sensors (Basel). 2018 May 18;18(5):1623. doi: 10.3390/s18051623. Sensors (Basel). 2018. PMID: 29783713 Free PMC article.
-
Advances in Microfluidics for Single Red Blood Cell Analysis.Biosensors (Basel). 2023 Jan 9;13(1):117. doi: 10.3390/bios13010117. Biosensors (Basel). 2023. PMID: 36671952 Free PMC article. Review.
-
Particle Classification through the Analysis of the Forward Scattered Signal in Optical Tweezers.Sensors (Basel). 2021 Sep 15;21(18):6181. doi: 10.3390/s21186181. Sensors (Basel). 2021. PMID: 34577401 Free PMC article.
-
Plasmonic Sensors for Monitoring Biological and Chemical Threat Agents.Biosensors (Basel). 2020 Oct 15;10(10):142. doi: 10.3390/bios10100142. Biosensors (Basel). 2020. PMID: 33076308 Free PMC article. Review.
References
-
- Camp C.H., Jr., Cicerone M.T. Chemically sensitive bioimaging with coherent Raman scattering. Nat. Photonics. 2015;9:295–305. doi: 10.1038/nphoton.2015.60. - DOI
-
- Thurn R., Kiefer W. Raman-Microsampling Technique Applying Optical Levitation by Radiation Pressure. Appl. Spectrosc. 1984;38:78–83. doi: 10.1366/0003702844554440. - DOI
-
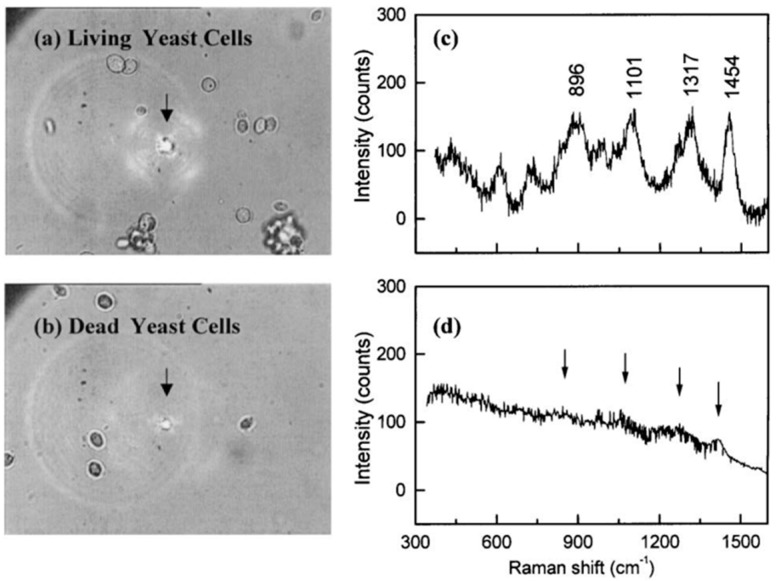
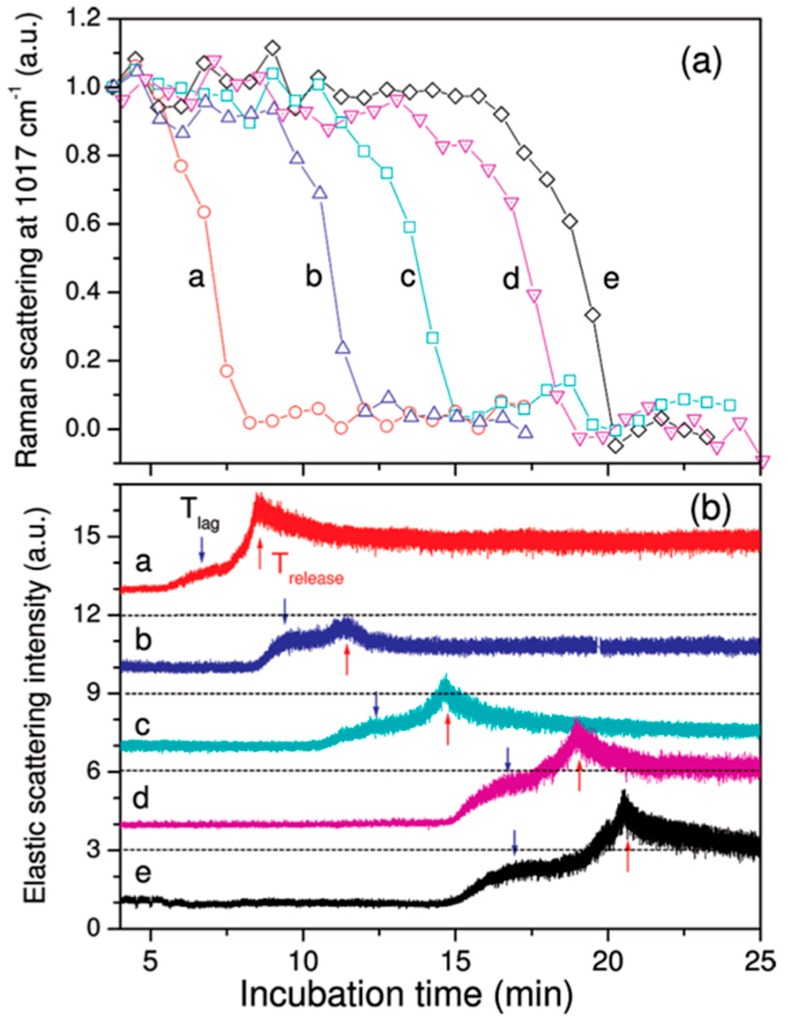
- Xie C., Li Y.Q., Tang W., Newton R.J. Study of dynamical process of heat denaturation in optically trapped single microorganisms by near-infrared Raman spectroscopy. J. Appl. Phys. 2003;94:6138–6142. doi: 10.1063/1.1617359. - DOI
Publication types
MeSH terms
LinkOut - more resources
Full Text Sources
Other Literature Sources
