Randomized Controlled Trial
. 2015 Aug 3;7(8):6281-93.
doi: 10.3390/nu7085285.

The Pattern of Fatty Acids Displaced by EPA and DHA Following 12 Months Supplementation Varies between Blood Cell and Plasma Fractions

Affiliations
Randomized Controlled Trial

The Pattern of Fatty Acids Displaced by EPA and DHA Following 12 Months Supplementation Varies between Blood Cell and Plasma Fractions

Celia G Walker et al. Nutrients. .

Abstract

Eicosapentaenoic acid (EPA) and docosahexaenoic acid (DHA) are increased in plasma lipids and blood cell membranes in response to supplementation. Whilst arachidonic acid (AA) is correspondingly decreased, the effect on other fatty acids (FA) is less well described and there may be site-specific differences. In response to 12 months EPA + DHA supplementation in doses equivalent to 0-4 portions of oily fish/week (1 portion: 3.27 g EPA+DHA) multinomial regression analysis was used to identify important FA changes for plasma phosphatidylcholine (PC), cholesteryl ester (CE) and triglyceride (TAG) and for blood mononuclear cells (MNC), red blood cells (RBC) and platelets (PLAT). Dose-dependent increases in EPA + DHA were matched by decreases in several n-6 polyunsaturated fatty acids (PUFA) in PC, CE, RBC and PLAT, but were predominantly compensated for by oleic acid in TAG. Changes were observed for all FA classes in MNC. Consequently the n-6:n-3 PUFA ratio was reduced in a dose-dependent manner in all pools after 12 months (37%-64% of placebo in the four portions group). We conclude that the profile of the FA decreased in exchange for the increase in EPA + DHA following supplementation differs by FA pool with implications for understanding the impact of n-3 PUFA on blood lipid and blood cell biology.

Keywords: EPA and DHA supplementation; blood cell fatty acids; fatty acid displacement; n-3 fatty acid; n-6 fatty acid; plasma fatty acid fractions.


Figures
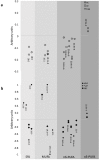
Figure 1
Figure 1
Patterns of modelled changes in fatty acids which occur with the increase in eicosapentaenoic acid (EPA) and docosahexaenoic acid (DHA) in (a) plasma and (b) blood cell fatty acid pools. Linear combinations of the co-efficients from the multinomial linear regression models were calculated for each fatty acid important for the change in EPA + DHA. As a small regression coefficient for the fatty acid of interest reflected a large change in the outcomes EPA + DHA and vice versa the data are the reciprocal of the co-efficients in order to portray the magnitude of effect, and this is presented in arbitrary units. Fatty acids are grouped according to class to depict the patterns of change in fatty acids for each pool.
Figure 2
Figure 2
Mean change in key fatty acids in response to 12 months supplementation of EPA + DHA equivalent to 0, 1, 2 or 4 portions of fish per week in different plasma and blood cell pools. The observed mean ± SE change from baseline in the fatty acids identified as important in relation to change in EPA + DHA in the multinomial regression models in (a) Plasma PC; (b) Plasma CE; (c) Plasma TAG; (d) RBC; (e) PLAT; (f) MNC. The effect of dose was tested by linear regression models for each fatty acid. Each model was tested with and without age and sex which were included as covariates if significant. Change in dietary SFA, MUFA, n-3 PUFA or n-6 PUFA where relevant were also tested to determine if change in diet influenced the change in fatty acids with EPA + DHA dose. Significant effects of dose detected in these models are shown as: * p < 0.05; ** p < 0.01; *** p < 0.0001; Effect of dose (p = 0.05) only when taking into account the change in dietary n-6 PUFA from baseline to 12 months; Effect of dose (p < 0.05) is no longer significant when taking into account the effect of change in dietary MUFA.
Figure 2
Figure 2
Mean change in key fatty acids in response to 12 months supplementation of EPA + DHA equivalent to 0, 1, 2 or 4 portions of fish per week in different plasma and blood cell pools. The observed mean ± SE change from baseline in the fatty acids identified as important in relation to change in EPA + DHA in the multinomial regression models in (a) Plasma PC; (b) Plasma CE; (c) Plasma TAG; (d) RBC; (e) PLAT; (f) MNC. The effect of dose was tested by linear regression models for each fatty acid. Each model was tested with and without age and sex which were included as covariates if significant. Change in dietary SFA, MUFA, n-3 PUFA or n-6 PUFA where relevant were also tested to determine if change in diet influenced the change in fatty acids with EPA + DHA dose. Significant effects of dose detected in these models are shown as: * p < 0.05; ** p < 0.01; *** p < 0.0001; Effect of dose (p = 0.05) only when taking into account the change in dietary n-6 PUFA from baseline to 12 months; Effect of dose (p < 0.05) is no longer significant when taking into account the effect of change in dietary MUFA.

References

    1. Deckelbaum R., Torrejon C. The omega-3 fatty acid nutritional landscape: Health benefits and sources. J. Nutr. 2012;142:587S–591S. doi: 10.3945/jn.111.148080. - DOI - PMC - PubMed
    1. Saravanan P., Davidson N.C., Schmidt E.B., Calder P.C. Cardiovascular effects of marine omega-3 fatty acids. Lancet. 2010;376:540–550. doi: 10.1016/S0140-6736(10)60445-X. - DOI - PubMed
    1. Calder P.C. Very long chain omega-3 (n-3) fatty acids and human health. Eur. J. Lipid Sci. Technol. 2014;116:1280–1300. doi: 10.1002/ejlt.201400025. - DOI
    1. Hoy S., Keating G. Omega-3 ethylester concentrate. Drugs. 2009;69:1077–1105. doi: 10.2165/00003495-200969080-00008. - DOI - PubMed
    1. Bradberry J.C., Hilleman D.E. Overview of omega-3 fatty acid therapies. P T. 2013;38:681–691. - PMC - PubMed

Publication types

MeSH terms