Randomized Controlled Trial
. 2015 Aug 4;7(8):6405-24.
doi: 10.3390/nu7085289.

Modification of Docosahexaenoic Acid Composition of Milk from Nursing Women Who Received Alpha Linolenic Acid from Chia Oil during Gestation and Nursing

Affiliations
Randomized Controlled Trial

Modification of Docosahexaenoic Acid Composition of Milk from Nursing Women Who Received Alpha Linolenic Acid from Chia Oil during Gestation and Nursing

Rodrigo Valenzuela et al. Nutrients. .

Abstract

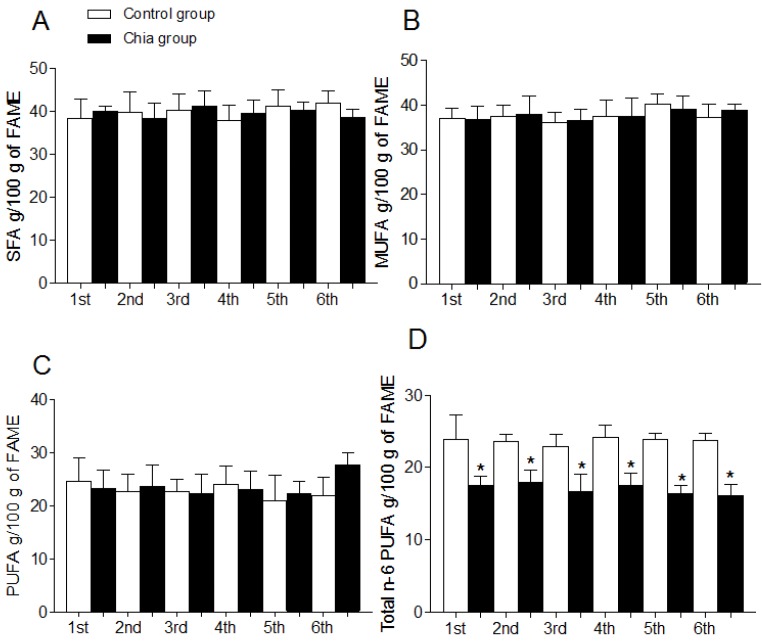
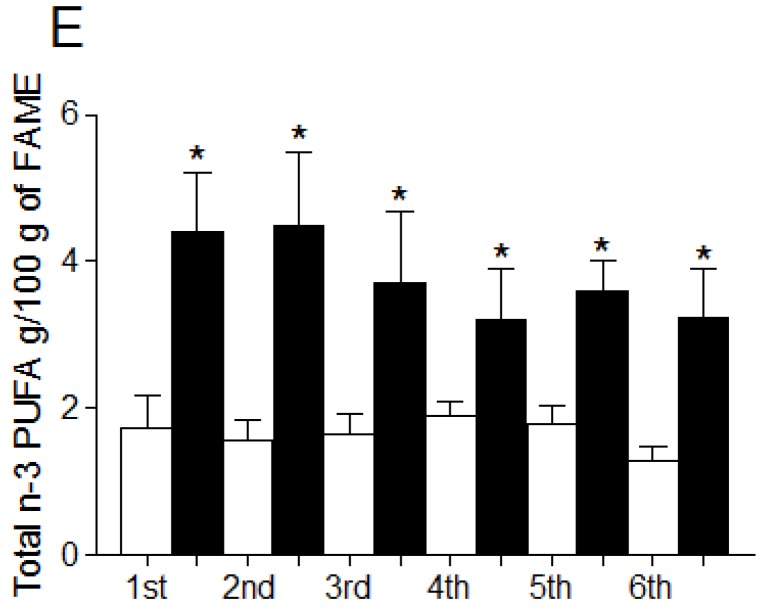
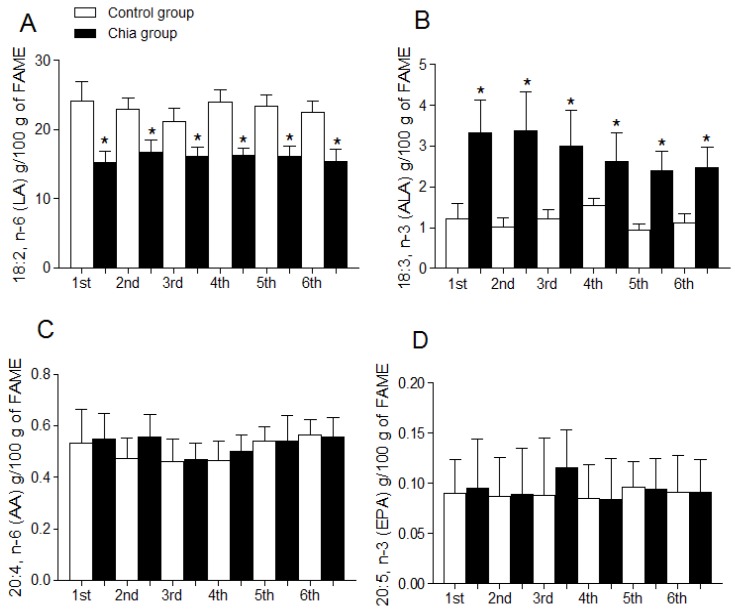
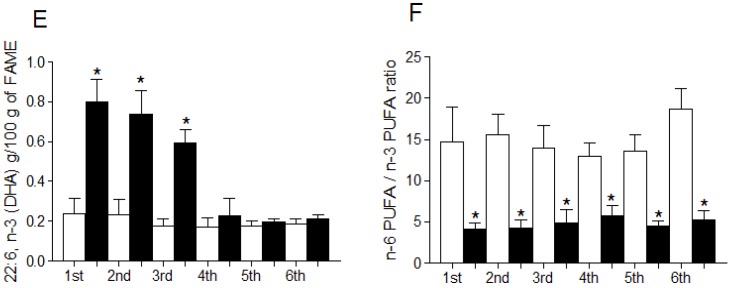
α-Linolenic acid (ALA) is the precursor of docosahexaenoic acid (DHA) in humans, which is fundamental for brain and visual function. Western diet provides low ALA and DHA, which is reflected in low DHA in maternal milk. Chia oil extracted from chia (Salvia hispanica L.), a plant native to some Latin American countries, is high in ALA (up to 60%) and thereby is an alternative to provide ALA with the aim to reduce DHA deficits. We evaluated the modification of the fatty acid profile of milk obtained from Chilean mothers who received chia oil during gestation and nursing. Forty healthy pregnant women (22-35 years old) tabulated for food consumption, were randomly separated into two groups: a control group with normal feeding (n = 21) and a chia group (n = 19), which received 16 mL chia oil daily from the third trimester of pregnancy until the first six months of nursing. The fatty acid profile of erythrocyte phospholipids, measured at six months of pregnancy, at time of delivery and at six months of nursing, and the fatty acid profile of the milk collected during the first six months of nursing were assessed by gas-chromatography. The chia group, compared to the control group, showed (i) a significant increase in ALA ingestion and a significant reduction of linoleic acid (LA) ingestion, no showing modification of arachidonic acid (AA), eicosapentaenoic acid (EPA) and DHA; (ii) a significant increase of erythrocyte ALA and EPA and a reduction of LA. AA and DHA were not modified; (iii) a increased milk content of ALA during the six months of nursing, whereas LA showed a decrease. AA and EPA were not modified, however DHA increased only during the first three months of nursing. Consumption of chia oil during the last trimester of pregnancy and the first three months of nursing transiently increases the milk content of DHA.

Keywords: ALA and DHA in milk; chia oil; erythrocyte phospholipids; pregnancy and nursing.


Figures

Figure 1
Figure 1
Total fatty acid composition of breast milk from mothers during nursing. Saturated fatty acids (SFA) (A); Monounsaturated fatty acids (MUFA) (B); Polyunsaturated fatty acids (PUFA) (C); Total n-6 PUFA (D); Total n-3 PUFA (E). Data are expressed as g fatty acid per 100 g FAME and represent the mean ± SD for n = 21 women (control group) and n = 19 (chia group). Statistical significance (p < 0.05); *: indicates significantly different when comparing the chia group with the control group for each month of nursing (t-test) and for all months of nursing (One-way ANOVA and Newman-Keuls test). SFA correspond to 6:0, 8:0, 10:0, 12:0, 14:0, 16:0, 18:0, 20:0 and 22:0, 24:0. MUFA correspond to 14:1 n-5, 16:1 n-7 and 18:1, n-9. PUFA correspond to 18:2 n-6, 18:3 n-3, 20:4 n-6, 20:5 n-3, 22:5 n-3 and 22:6 n-3.
Figure 1
Figure 1
Total fatty acid composition of breast milk from mothers during nursing. Saturated fatty acids (SFA) (A); Monounsaturated fatty acids (MUFA) (B); Polyunsaturated fatty acids (PUFA) (C); Total n-6 PUFA (D); Total n-3 PUFA (E). Data are expressed as g fatty acid per 100 g FAME and represent the mean ± SD for n = 21 women (control group) and n = 19 (chia group). Statistical significance (p < 0.05); *: indicates significantly different when comparing the chia group with the control group for each month of nursing (t-test) and for all months of nursing (One-way ANOVA and Newman-Keuls test). SFA correspond to 6:0, 8:0, 10:0, 12:0, 14:0, 16:0, 18:0, 20:0 and 22:0, 24:0. MUFA correspond to 14:1 n-5, 16:1 n-7 and 18:1, n-9. PUFA correspond to 18:2 n-6, 18:3 n-3, 20:4 n-6, 20:5 n-3, 22:5 n-3 and 22:6 n-3.
Figure 2
Figure 2
Individual fatty acid composition of breast milk from mothers during nursing. 18:2, n-6 (LA) (A); 18:3, n-3 (ALA) (B); 20:4, n-6 (AA) (C); 20:5, n-3 (EPA) (D); 22:6, n-3 (DHA) (E); (F). Data are expressed as g fatty acid per 100 g FAME and represent the mean ± SD for n = 21 women (control group) and n = 19 (chia group). Statistical significance (p < 0.05); *: indicates significant difference when comparing the chia group with the control group for each month of nursing (t-test) and for all months of nursing (One-way ANOVA and Newman-Keuls test). n-6 PUFA/n-3 PUFA ratio is (18:2, n-6 + 20:4, n-6)/(18:3, n-3 + 20:5, n-3 + 22:5, n-3 + 22:6, n-3).
Figure 2
Figure 2
Individual fatty acid composition of breast milk from mothers during nursing. 18:2, n-6 (LA) (A); 18:3, n-3 (ALA) (B); 20:4, n-6 (AA) (C); 20:5, n-3 (EPA) (D); 22:6, n-3 (DHA) (E); (F). Data are expressed as g fatty acid per 100 g FAME and represent the mean ± SD for n = 21 women (control group) and n = 19 (chia group). Statistical significance (p < 0.05); *: indicates significant difference when comparing the chia group with the control group for each month of nursing (t-test) and for all months of nursing (One-way ANOVA and Newman-Keuls test). n-6 PUFA/n-3 PUFA ratio is (18:2, n-6 + 20:4, n-6)/(18:3, n-3 + 20:5, n-3 + 22:5, n-3 + 22:6, n-3).

References

    1. Innis S.M. Dietary (n-3) fatty acids and brain development. J. Nutr. 2007;137:855–859. - PubMed
    1. Campoy C., Escolano-Margarit M.V., Anjos T., Szajewska H., Uauy R. Omega 3 fatty acids on child growth, visual acuity and neurodevelopment. Br. J. Nutr. 2012;107:S85–S106. doi: 10.1017/S0007114512001493. - DOI - PubMed
    1. Barceló-Coblijn G., Murphy E.J. Alpha-linolenic acid and its conversion to longer chain n-3 fatty acids: Benefits for human health and a role in maintaining tissue n-3 fatty acid levels. Prog. Lipid Res. 2009;48:355–374. doi: 10.1016/j.plipres.2009.07.002. - DOI - PubMed
    1. Holman R.T., Johnson S.B., Hatch T.F. A case of human linolenic acid deficiency involving neurological abnormalities. Am. J. Clin. Nutr. 1982;35:617–623. - PubMed
    1. Bjerve K.S., Fischer S., Alme K. Alpha-linolenic acid deficiency in man: Effect of ethyl linolenate on plasma and erythrocyte fatty acid composition and biosynthesis of prostanoids. Am. J. Clin. Nutr. 1987;46:570–576. - PubMed

Publication types

MeSH terms

LinkOut - more resources