. 2015 Aug 6;10(8):e0134676.
doi: 10.1371/journal.pone.0134676. eCollection 2015.

Lithium Modulates Autophagy in Esophageal and Colorectal Cancer Cells and Enhances the Efficacy of Therapeutic Agents In Vitro and In Vivo

Affiliations

Lithium Modulates Autophagy in Esophageal and Colorectal Cancer Cells and Enhances the Efficacy of Therapeutic Agents In Vitro and In Vivo

Tracey R O'Donovan et al. PLoS One. .

Abstract

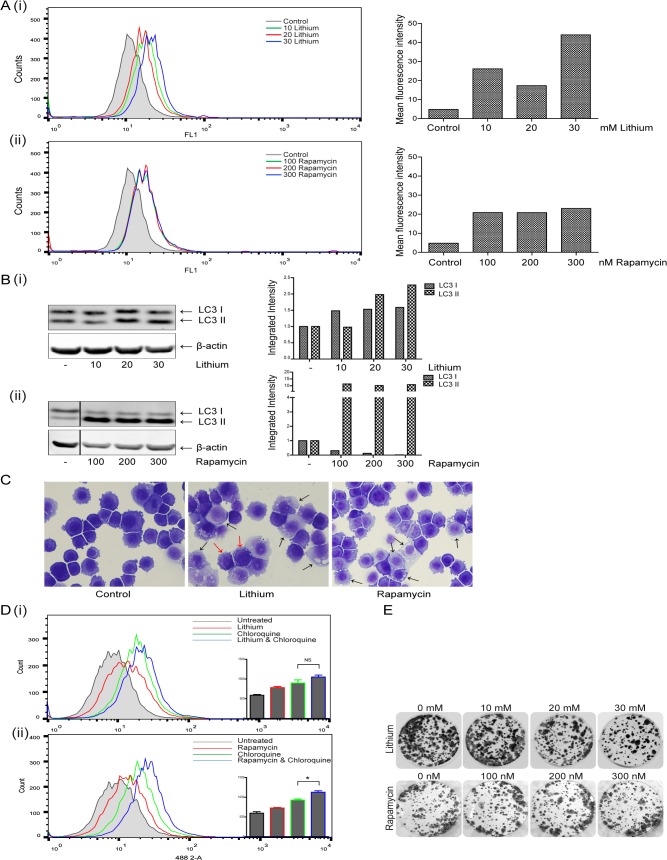
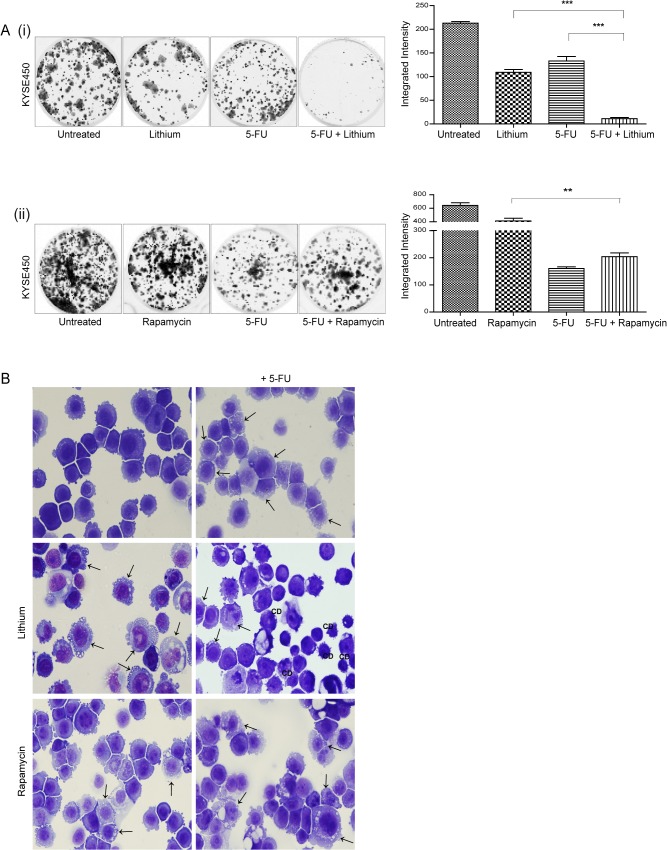
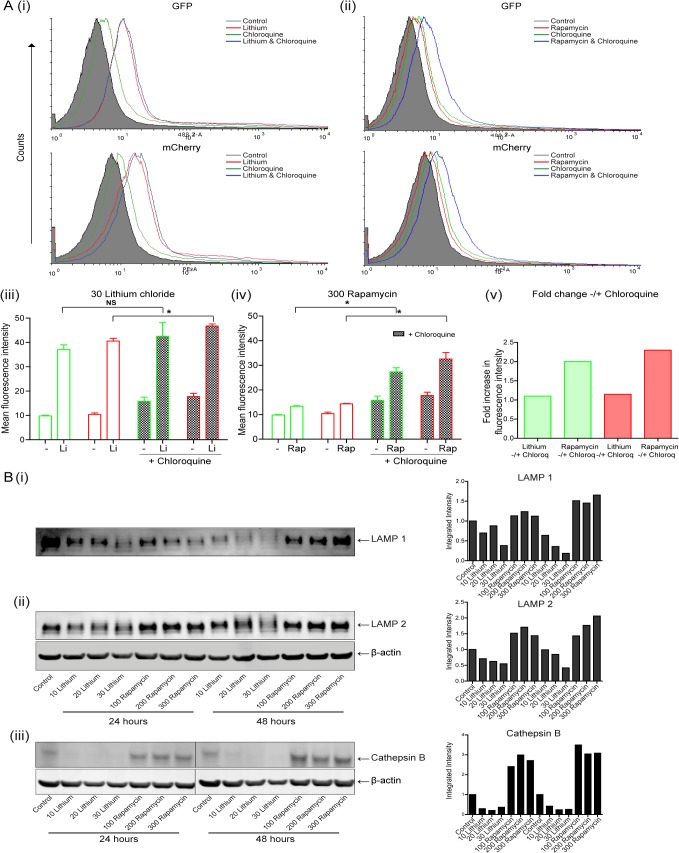
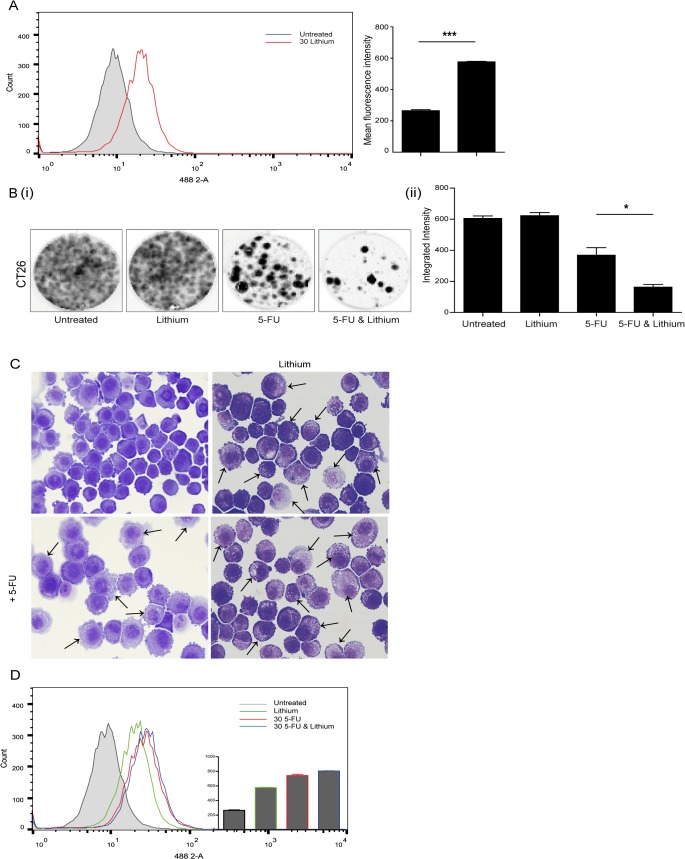
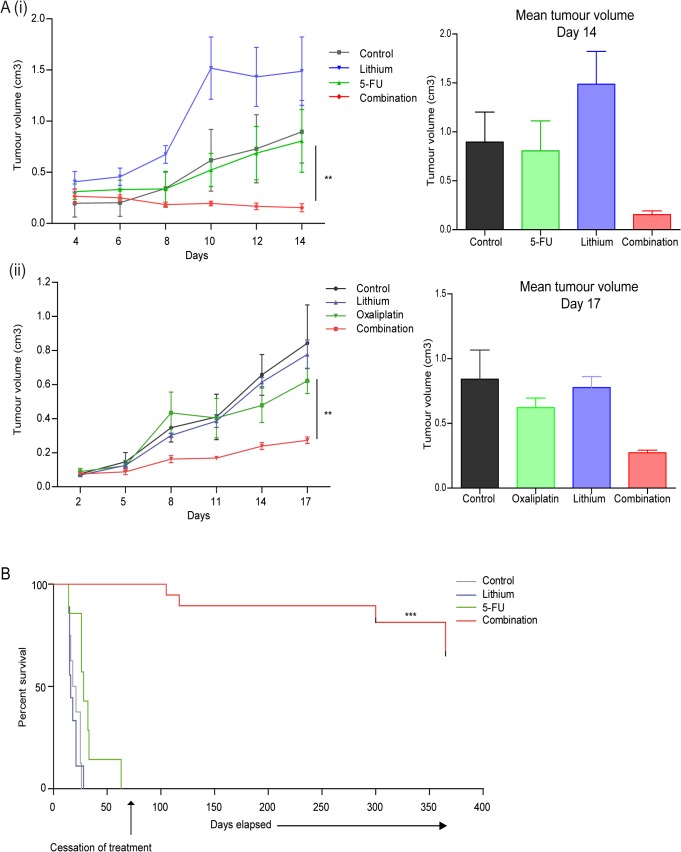
Many epithelial cancers, particularly gastrointestinal tract cancers, remain poor prognosis diseases, due to resistance to cytotoxic therapy and local or metastatic recurrence. We have previously shown that apoptosis incompetent esophageal cancer cells induce autophagy in response to chemotherapeutic agents and this can facilitate their recovery. However, known pharmacological inhibitors of autophagy could not enhance cytotoxicity. In this study, we have examined two well known, clinically approved autophagy inducers, rapamycin and lithium, for their effects on chemosensitivity in apoptosis incompetent cancer cells. Both lithium and rapamycin were shown to induce autophagosomes in esophageal and colorectal cancer cells by western blot analysis of LC3 isoforms, morphology and FACS quantitation of Cyto-ID or mCherry-GFP-LC3. Analysis of autophagic flux indicates inefficient autophagosome processing in lithium treated cells, whereas rapamycin treated cells showed efficient flux. Viability and recovery was assessed by clonogenic assays. When combined with the chemotherapeutic agent 5-fluorouracil, rapamycin was protective. In contrast, lithium showed strong enhancement of non-apoptotic cell death. The combination of lithium with 5-fluorouracil or oxaliplatin was then tested in the syngenic mouse (balb/c) colorectal cancer model--CT26. When either chemotherapeutic agent was combined with lithium a significant reduction in tumor volume was achieved. In addition, survival was dramatically increased in the combination group (p < 0.0001), with > 50% of animals achieving long term cure without re-occurrence (> 1 year tumor free). Thus, combination treatment with lithium can substantially improve the efficacy of chemotherapeutic agents in apoptosis deficient cancer cells. Induction of compromised autophagy may contribute to this cytotoxicity.


Conflict of interest statement

Competing Interests: The authors have declared that no competing interests exist.

Figures

Fig 1
Fig 1. Evaluation of the effects of Lithium and Rapamycin on autophagy induction in esophageal cancer cells.
(A) KYSE450 cells were treated with lithium chloride (lithium) (10–30 mM) or rapamycin (100–300 nM) for 24 and 48 hours. Cells were assessed for autophagy induction 24 hours after treatment with lithium (i) or rapamycin (ii) with the Cyto-ID autophagy detection kit. Panels on the left show representative images of FACS analysis, with panels to the right showing corresponding mean fluorescence intensity. Data shown here is representative of three independent experiments. (B) Western blot analysis of LC3 expression in cells treated with lithium (i) or rapamycin (ii) for 24 hours. LC3I and LC3II bands were quantified using the Odyssey Infrared Imaging System (Li-COR), normalized to β-actin and presented as integrated intensities. (C) Morphological features of KYSE450 cells following lithium (30 mM, center panel) or rapamycin (300 nM, right hand panel) treatment for 24 hours. Black arrows indicate accumulation of vesicles in both lithium and rapamycin treated cells, red arrows denote peripheral vesicle accumulation (Magnification 40x). (D) Cells were pretreated with chloroquine (10 μM) for two hours, prior to treatment with lithium (10 mM) (i) or rapamycin (100 nM) (ii) for 48 hours and autophagy levels assessed with the Cyto-ID autophagy detection kit. Representative images of FACS analysis are shown (n = 3), with inset bar graphs showing corresponding mean fluorescence intensity (* p < 0.05). E Viable cells following treatment with either lithium or rapamycin for 48 hours were counted and equal numbers (1,500 cells per well) reseeded in triplicate, in the absence of drug. Cells were allowed to grow for 14 days, then were fixed and stained and colony regrowth assessed.
Fig 2
Fig 2. Assessment of the effect of autophagy inducers on chemosensitivity in human esophageal cancer cells.
KYSE450 cells were treated with lithium chloride (lithium) (30 mM) or rapamycin (300 nM) alone or in combination with 5-fluorouracil (5-FU) (40 μM) for 48 hours. (A) Viable cells following treatment with either lithium (i) or rapamycin (ii) alone or in combination with 5-FU for 48 hours were counted and equal numbers reseeded in triplicate, in the absence of drug. Cells were allowed to grow for 14 days, then were fixed and stained and colonies quantified using the Odyssey Infrared Imaging System (Li-COR). Data is presented graphically as the mean +/- SEM of three independent experiments. Asterisks indicate a significant difference in the number of colonies formed in combination treated cells compared to single agent treated cells (*** p < 0.0005, ** p < 0.005) (unpaired t-test). (B) Morphological features of KYSE450 cells were examined following treatment for 48 hours. Panels to the left show the morphology induced in response to lithium or rapamycin alone, panels to the right show morphology with the addition of 5-FU. Arrows indicate the accumulation of autophagic vesicles in lithium, rapamycin, 5-FU and combination treated cells. CD denotes the presence of a non-apoptotic cell death morphology (Magnification 40x).
Fig 3
Fig 3. Examination of the autophagosome processing in esophageal cells following treatment with lithium or rapamycin.
(A) KYSE450 cells were transfected with pBABE-puro mCherry-EGFP-LC3B expression plasmid. Twenty four hours later, cells were treated with lithium (30 mM) or rapamycin (300 nM) alone or in the presence of chloroquine (10 μM) for 48 hours. Following treatment, cells were harvested and analysed by flow cytometry for EGFP (488 2-A) and mCherry (PE-A) expression. Representative histograms of GFP (upper) and mCherry (lower) for both lithium (i) and rapamycin (ii) treated cells, without (red overlays) and with chloroquine (blue overlays) are shown. Data is presented as mean fluorescence intensity (MFI) of three independent experiments for both GFP and mCherry in lithium (iii) and rapamycin (iv) treated cells (n = 3). The fold change in GFP (green bars) and mCherry (red bars) MFIs between lithium or rapamycin, without and with chloroquine is presented to the right (v). Asterisks indicate a significant difference in the MFI (* p < 0.05). (B) Western blot analysis of LAMP 1 (i), LAMP 2 (ii) and cathepsin B (iii) expression in cells treated with lithium (10–30 mM) or rapamycin (100–300 nM) for 24 and 48 hours. All bands were quantified using the Odyssey Infrared Imaging System (Li-COR), normalized to β-actin and presented as integrated intensities.
Fig 4
Fig 4. Assessment of the effect of combining autophagy inducers on chemosensitivity in CT26 murine colorectal cells.
(A) The induction of autophagy in CT26 cells, following lithium treatment (30 mM) for 24 hours, was assessed with the Cyto-ID autophagy detection kit. (B) Viable cells following treatment with lithium alone or in combination with 5-fluorouracil (5-FU) (20 μM) for 24 hours were counted and equal numbers reseeded in triplicate, in the absence of drug. (i) Cells were allowed to grow for 14 days, then were fixed and stained and colonies quantified using the Odyssey Infrared Imaging System (Li-COR). (ii) Data is presented graphically as the mean +/- SEM of three independent experiments. Asterisks indicate a significant difference in the number of colonies formed in combination treated cells compared to single agent treated cells (* p < 0.05) (unpaired t-test). (C) Morphological features of CT26 cells were examined following treatment for 24 hours. Panels to the right show the morphology induced in response to lithium alone (upper) and in combination with 5-FU (lower). Lower left panel shows morphology in cells treated with 5-FU alone. Arrows indicate the accumulation of vesicles in lithium, 5-FU and combination treated cells (Magnification 40x). (D) Cells were treated with either lithium (30 mM), 5-FU (20 μM) or a combination of both for 24 hours and autophagy levels assessed with the Cyto-ID autophagy detection kit. Representative image of FACS analysis with insert showing corresponding mean fluorescence intensity (n = 3).
Fig 5
Fig 5. In vivo implementation of combination therapy in pre-clinical CT26 colorectal carcinoma model.
To assess the effects of combination therapy on tumor volume and survival (A) (i) Colorectal carcinoma cells (CT26) (1 x 10⁶) were injected subcutaneously into the right flank of female balb/c mice (n = 3 per group). When mean tumor diameters were 0.5 cm +/- 0.02cm (~14 days post injection of tumor cells) all animals received an intratumoral injection every three days of either PBS (control), 5-fluorouracil (5-FU) (20 mg/kg), lithium chloride (200 mg/kg) or combinations of 5-FU and lithium chloride for two weeks. Tumor size was monitored by alternate day measurements in two dimensions, using verniers callipers, with first measurement recorded four days after initial treatment. Tumor volume was calculated according to the formula V = ab2ᴨ/6, where ‘a’ is the longest diameter of the tumor and ‘b’ is the longest diameter perpendicular to diameter ‘a’. (ii) CT26 cells (1 x 10⁶) were injected and tumors allowed to develop as above (n = 4 per group). To assess effects of systemically delivered combination therapy on primary tumors all treated and control groups received intraperitoneal injection every three days, of either PBS (control), oxaliplatin (10 mg/kg), lithium chloride (200 mg/kg) or combinations of oxaliplatin and lithium chloride for up to three weeks. Tumor size was assessed every three days, with the first measurement recorded two days after initial treatment. Tumor volume was calculated as above. Asterisks indicate a significant difference in the mean tumor volume of combination treated animals compared to single agent treated tumors (5-FU or oxaliplatin) (** p < 0.01) (unpaired t-test). (B) To assess the antitumor effect of combination therapy on survival, CT26 tumors were induced as above in balb/c mice (n = 8 per group) and once tumors were established all treated and control groups received an intratumoral injection every three days with PBS (control), lithium chloride (200mg/kg), 5-FU (20mg/kg) and a combination of both lithium chloride and 5-FU (200mg/kg, 20mg/kg). When tumor volume reached ~ 1.5 cm3 (no greater than 1.5 cm in diameter) animals were euthanized. The median survival for control treated animals was 19.5 days, lithium treated– 16 days, 5-FU treated– 28 days. Median survival of combination treated group is undefined due to long term survival of more than half the group. Treatment of the remaining combination treated animals was maintained until day 75, following which all treatments ceased. One year after treatment began these animals remained tumor free. Asterisks indicate a significant difference in the overall median survival of combination treated (5-FU & lithium chloride) animals compared to single agent treated animals (5-FU) (*** p < 0.0001). Statistical analysis was carried out using the log-rank test.

Similar articles

Cited by

References

    1. Lorin S, Hamai A, Mehrpour M, Codogno P. Autophagy regulation and its role in cancer. Semin Cancer Biol. 2013;23(5):361–79. Epub 2013/07/03. S1044-579X(13)00058-8 [pii] 10.1016/j.semcancer.2013.06.007 . - DOI - PubMed
    1. Sui X, Chen R, Wang Z, Huang Z, Kong N, Zhang M, et al. Autophagy and chemotherapy resistance: a promising therapeutic target for cancer treatment. Cell Death Dis. 2013;4:e838 10.1038/cddis.2013.350 - DOI - PMC - PubMed
    1. Shimizu S, Yoshida T, Tsujioka M, Arakawa S. Autophagic cell death and cancer. International journal of molecular sciences. 2014;15(2):3145–53. Epub 2014/02/26. 10.3390/ijms15023145 . - DOI - PMC - PubMed
    1. O'Donovan TR, O'Sullivan GC, McKenna SL. Induction of autophagy by drug-resistant esophageal cancer cells promotes their survival and recovery following treatment with chemotherapeutics. Autophagy. 2011;7(5):509–24. Epub 2011/02/18. 15066 [pii]. . - PMC - PubMed
    1. Zhou S, Zhao L, Kuang M, Zhang B, Liang Z, Yi T, et al. Autophagy in tumorigenesis and cancer therapy: Dr. Jekyll or Mr. Hyde? Cancer Lett. 2012;323(2):115–27. Epub 2012/05/01. 10.1016/j.canlet.2012.02.017 . - DOI - PubMed

Publication types

MeSH terms