. 2016 Jan;40(1):112-20.
doi: 10.1038/ijo.2015.145. Epub 2013 Aug 7.

Large adipocytes function as antigen-presenting cells to activate CD4(+) T cells via upregulating MHCII in obesity

Affiliations

Large adipocytes function as antigen-presenting cells to activate CD4(+) T cells via upregulating MHCII in obesity

L Xiao et al. Int J Obes (Lond). 2016 Jan.

Abstract

Background/objectives: Although obesity is associated with low-grade inflammation and metabolic disorders, clinical studies suggested some obese people were metabolically healthy with smaller adipocyte size compared with metabolically abnormal obese (MAO). This indicated adipocyte size may be an important predictor underlay the distinction between MAO and metabolically healthy obese. As recent study has shown that adipocytes expressed class II major histocompatibility complex (MHCII), which functioned as APCs during obesity. However, the relationship between adipocyte hypertrophy and MHCII expression was not involved. Here we hypothesize that hypertrophic adipocytes could be associated with upregulating MHCII to influence adipose tissue metabolism.

Methods: Adipocytes were sorted by fluorescence-activated cell sorting (FACS) according to the cell size from MAO mice. The activation of MHCII, T cells and related signaling molecules were examined by FACS, ELISA and western blotting. 3T3-L1 cell line and primary adipocytes were used to examine the effect of free fatty acids (FFA) on adipocytes enlargement and MHCII expression.

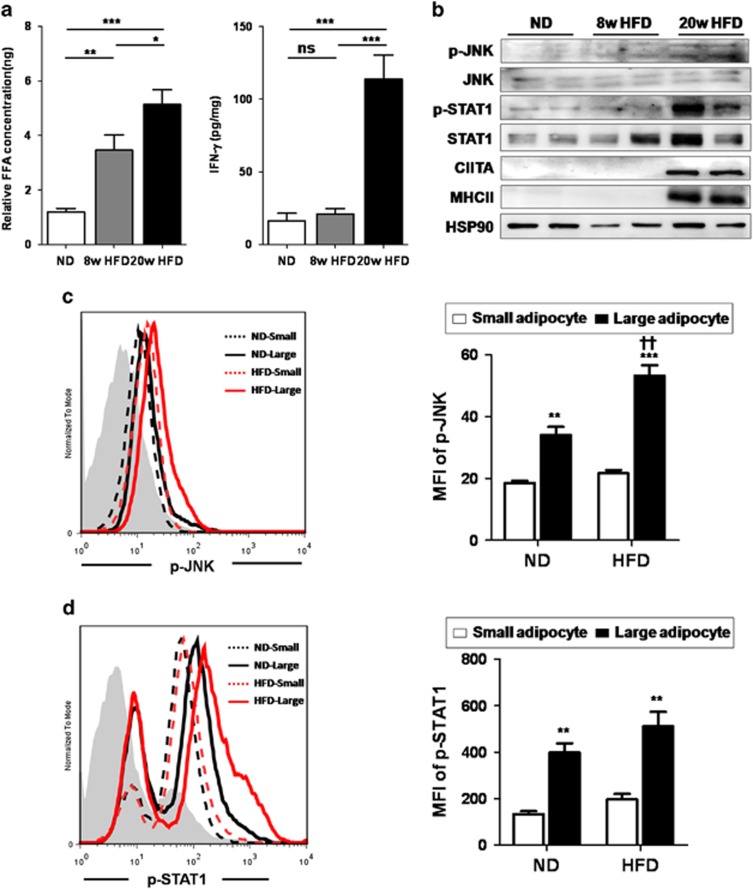
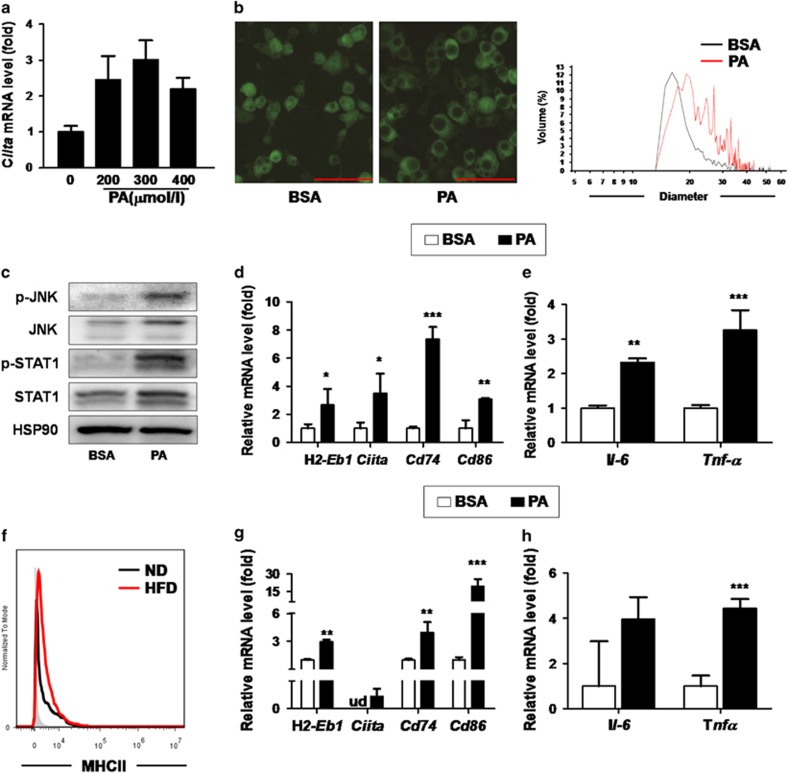
Results: MAO mice had a significant increase in adipocytes size and FFA concentration. The large adipocytes from both obese and non-obese mice expressed higher levels of MHCII than small adipocytes. Importantly, large adipocytes from obese mice stimulated CD4(+) T cells to secrete more interferon (IFN)-γ. Furthermore, the activation of the JNK-STAT1 pathway was involved in upregulation of MHCII in large adipocytes. In vitro FFA treatment promoted adipocyte hypertrophy and expression of MHCII-associated genes.

Conclusions: This study demonstrates that large adipocytes highly express MHCII and function as APC to stimulate IFN-γ-expressing CD4(+) T cells, in which FFA may have important roles before IFN-γ elevated. These findings suggest that adipocyte hypertrophy, rather than overall obesity, is the major contributor to adipose tissue inflammation and insulin resistance.


Figures

Figure 1
Figure 1
Adipocytes size increases in insulin-resistant mice fed with HFD. (a) Fat index (percentage of fat pad weight relative to the whole body weight); (b) glucose concentrations during glucose tolerance test or insulin tolerance test; (c) morphologic comparison and H&E staining (scale bar=20μm); (d) H&E staining sections quantification of adipocytes diameter; (e) polystyrene particles and representative adipocytes flow cytometric analysis, three polystyrene particles with mean size at 24.6, 33.5 and 43.6 were used. (f) Percentage of large adipocytes by flow cytometric analysis. All the results detected in mice fed with ND or HFD (n=6–7). All the mice fed with ND or HFD for 20 weeks if not indicated otherwise. *P<0.05, **P<0.01, ***P<0.001. SSC, side scatter.
Figure 2
Figure 2
The expression of MHCII elevates in adipocytes of HFD-fed mice. (a) Representative flow cytometric analysis of MHCII with CD86 and (b) western blot analysis of MHCII in adipocytes of mice fed with ND or HFD. Similar results were obtained from 6 to 7 individual mice. 422/aP2 and HSP90 were used to identify mature adipocytes and loading control, respectively. (c) IFN-γ concentrations in supernatants of adipocytes were cultured alone or co-cultured with T cells (n=4–6). (d and e) CIITA, CD74, CD86, IL-6 and TNFα mRNA level in adipocytes; (f) concentrations of IL-6 and TNF-α in supernatants of cultured adipocytes. The results of cf detected in mice fed with ND or HFD (n=6). *P<0.05, **P<0.01, ***P<0.001 for ND vs HFD-fed. P<0.05 for adipocytes were cultured alone vs co-cultured with T cells in HFD fed.
Figure 3
Figure 3
Large adipocytes express higher levels of MHCII than small adipocytes and stimulate CD4+ T cells to secrete more IFN-γ in HFD-fed mice. (a and b) Flow cytometric analysis of MHCII and CD86 expression level (n=6–7); (c) IFN-γ concentrations in supernatants of adipocytes co-cultured with T cells (n=4–6); (d and e) CIITA, CD74, CD86, IL-6 and TNF-α mRNA level. All the results detected in small or large adipocytes in mice fed with ND or HFD. *P<0.05, **P<0.01, ***P<0.001 for small vs large adipocytes. ††P<0.01, †††P<0.001 for large adipocytes from ND- vs HFD-fed mice.
Figure 4
Figure 4
Activation of JNK-STAT1 pathway is involved in large adipocytes of HFD-fed mice with elevated FFA. (a) The relative contents of IFN-γ (left) and FFA (right) in adipose tissue (n=10–13) and (b) western blot analysis of p-JNK, JNK, p-STAT1, STAT1, CIITA and MHCII expression levels in adipocytes of mice fed with ND-, HFD for 8 weeks, HFD for 20 weeks (n=4–6). Mice fed a HFD for 8 weeks were presented as a gradient control. (c and d) Flow cytometric analysis of p-JNK and p-STAT1 expression levels in small or large adipocytes of mice fed with ND or HFD (n=6). *P<0.05, **P<0.01, ***P<0.001 for small vs large adipocytes. ††P<0.01 for large adipocytes from ND- vs HFD-fed mice.
Figure 5
Figure 5
Saturated fatty acids increase adipocytes size and expression of CIITA and MHCII in 3T3-L1 and primary adipocytes. Results of ae detected in 3T3-L1 adipocytes treated with bovine serum albumin (BSA) or palmitic acid (PA). (a) palmitic acid gradient response of CIITA mRNA expression; (b) 5-chloromethylfluorescein diacetate (CMFDA) staining (left) and cell size measurement (right, scale bar=100 μm); (c) western blot analysis of p-JNK, JNK, p-STAT1 and STAT1; (d and e) indicated genes mRNA level in mature adipocytes. Results of fh detected in primary adipocytes of 8-week-old mice. (f) Flow cytometric analysis of MHCII; (g and h) indicated genes mRNA level in primary adipocytes. *P<0.05, **P<0.01, ***P<0.001 for BSA vs palmitic acid treated.

References

    1. 1Stevens GA, Singh GM, Lu Y, Danaei G, Lin JK, Finucane MM et al. National, regional, and global trends in adult overweight and obesity prevalences. Popul Health Metr 2012; 10: 22. - PMC - PubMed
    1. 2Haslam DW, James WP. Obesity. Lancet 2005; 366: 1197–1209. - PubMed
    1. 3Cherqaoui R, Kassim TA, Kwagyan J, Freeman C, Nunlee-Bland G, Ketete M et al. The metabolically healthy but obese phenotype in African Americans. J Clin Hypertens 2012; 14: 92–96. - PMC - PubMed
    1. 4Fabbrini E, Yoshino J, Yoshino M, Magkos F, Tiemann Luecking C, Samovski D et al. Metabolically normal obese people are protected from adverse effects following weight gain. J Clin Invest 2015; 125: 787–795. - PMC - PubMed
    1. 5Bluher M. Are there still healthy obese patients? Curr Opin Endocrinol Diabetes Obesity 2012; 19: 341–346. - PubMed

Publication types

MeSH terms

Substances