Factors Associated with Glycemic Variability in Patients with Type 2 Diabetes: Focus on Oral Hypoglycemic Agents and Cardiovascular Risk Factors
- PMID: 26248860
- PMCID: PMC4595361
- DOI: 10.3803/EnM.2015.30.3.352
Factors Associated with Glycemic Variability in Patients with Type 2 Diabetes: Focus on Oral Hypoglycemic Agents and Cardiovascular Risk Factors
Abstract
Background: The role of glycemic variability (GV) in development of cardiovascular diseases remains controversial, and factors that determine glucose fluctuation in patients with diabetes are unknown. We investigated relationships between GV indices, kinds of oral hypoglycemic agents (OHAs), and cardiovascular risk factors in patients with type 2 diabetes mellitus (T2DM).
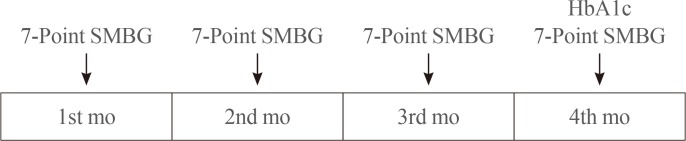
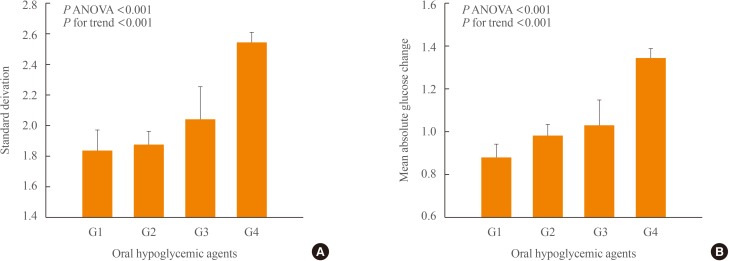
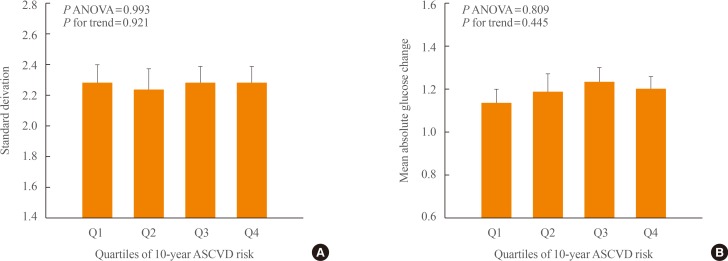
Methods: We analyzed 209 patients with T2DM. The GV index (standard deviation [SD] and mean absolute glucose change [MAG]) were calculated from 7-point self-monitoring of blood glucose profiles. The patients were classified into four groups according to whether they take OHAs known as GV-lowering (A) and GV-increasing (B): 1 (A only), 2 (neither), 3 (both A and B), and 4 (B only). The 10-year risk for atherosclerotic cardiovascular disease (ASCVD) was calculated using the Pooled Cohort Equations.
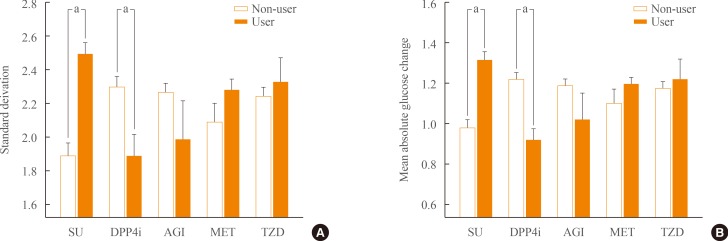
Results: GV indices were significantly higher in patients taking sulfonylureas (SUs), but lower in those taking dipeptidyl peptidase-4 inhibitors. In hierarchical regression analysis, the use of SUs remained independent correlates of the SD (γ=0.209, P=0.009) and MAG (γ=0.214, P=0.011). In four OHA groups, GV indices increased progressively from group 1 to group 4. However, these did not differ according to quartiles of 10-year ASCVD risk.
Conclusion: GV indices correlated significantly with the use of OHAs, particularly SU, and differed significantly according to combination of OHAs. However, cardiovascular risk factors and 10-year ASCVD risk were not related to GV indices. These findings suggest that GV is largely determined by properties of OHAs and not to cardiovascular complications in patients with T2DM.
Keywords: 10-year atherosclerotic cardiovascular disease risk; Cardiovascular risk factors; Diabetes mellitus, type 2; Glycemic variability; Oral hypoglycemic agents.
Conflict of interest statement
Figures
Similar articles
-
Prevalence of glycemic variability and factors associated with the glycemic arrays among end-stage kidney disease patients on chronic hemodialysis.Medicine (Baltimore). 2021 Jul 30;100(30):e26729. doi: 10.1097/MD.0000000000026729. Medicine (Baltimore). 2021. PMID: 34397709 Free PMC article.
-
Glycemic Variability Is Independently Associated With Poor Prognosis in Five Pediatric ICU Centers in Southwest China.Front Nutr. 2022 Feb 23;9:757982. doi: 10.3389/fnut.2022.757982. eCollection 2022. Front Nutr. 2022. PMID: 35284444 Free PMC article.
-
Randomized Study Comparing Vildagliptin vs Glibenclamide on Glucose Variability and Endothelial Function in Patients with Type 2 Diabetes Mellitus and Hypertension.Diabetes Metab Syndr Obes. 2020 Sep 15;13:3221-3229. doi: 10.2147/DMSO.S257096. eCollection 2020. Diabetes Metab Syndr Obes. 2020. PMID: 32982353 Free PMC article.
-
Glycemic Variability: How Do We Measure It and Why Is It Important?Diabetes Metab J. 2015 Aug;39(4):273-82. doi: 10.4093/dmj.2015.39.4.273. Diabetes Metab J. 2015. PMID: 26301188 Free PMC article. Review.
-
Type 2 Diabetes and Glycemic Variability: Various Parameters in Clinical Practice.J Clin Med Res. 2018 Oct;10(10):737-742. doi: 10.14740/jocmr3556w. Epub 2018 Sep 10. J Clin Med Res. 2018. PMID: 30214644 Free PMC article. Review.
Cited by
-
Combined assessment of stress hyperglycemia ratio and glycemic variability to predict all-cause mortality in critically ill patients with atherosclerotic cardiovascular diseases across different glucose metabolic states: an observational cohort study with machine learning.Cardiovasc Diabetol. 2025 May 9;24(1):199. doi: 10.1186/s12933-025-02762-0. Cardiovasc Diabetol. 2025. PMID: 40346649 Free PMC article.
-
Comparative Effectiveness of Oral Hypoglycemic Agents for Glycemic Control and Glycemic Variability in Patients with Type 2 Diabetes Mellitus: Using Flash Glucose Monitoring.Curr Diabetes Rev. 2024;21(1):e160124225706. doi: 10.2174/0115733998267817231227102553. Curr Diabetes Rev. 2024. PMID: 38310479 Free PMC article.
-
Prognostic value of longitudinal HbA1c variability in predicting the development of diabetic sensorimotor polyneuropathy among patients with type 2 diabetes mellitus: A prospective cohort observational study.J Diabetes Investig. 2024 Mar;15(3):326-335. doi: 10.1111/jdi.14131. Epub 2024 Jan 3. J Diabetes Investig. 2024. PMID: 38168098 Free PMC article.
-
New Insights into the Role of Visit-to-Visit Glycemic Variability and Blood Pressure Variability in Cardiovascular Disease Risk.Curr Cardiol Rep. 2021 Mar 2;23(4):25. doi: 10.1007/s11886-021-01454-x. Curr Cardiol Rep. 2021. PMID: 33655430 Free PMC article. Review.
-
Dipeptidyl-Peptidase-IV Inhibitors, Imigliptin and Alogliptin, Improve Beta-Cell Function in Type 2 Diabetes.Front Endocrinol (Lausanne). 2021 Sep 20;12:694390. doi: 10.3389/fendo.2021.694390. eCollection 2021. Front Endocrinol (Lausanne). 2021. PMID: 34616361 Free PMC article. Clinical Trial.
References
-
- Brownlee M. Biochemistry and molecular cell biology of diabetic complications. Nature. 2001;414:813–820. - PubMed
-
- Ohkubo Y, Kishikawa H, Araki E, Miyata T, Isami S, Motoyoshi S, et al. Intensive insulin therapy prevents the progression of diabetic microvascular complications in Japanese patients with non-insulin-dependent diabetes mellitus: a randomized prospective 6-year study. Diabetes Res Clin Pract. 1995;28:103–117. - PubMed
-
- UK Prospective Diabetes Study (UKPDS) Group. Intensive blood-glucose control with sulphonylureas or insulin compared with conventional treatment and risk of complications in patients with type 2 diabetes (UKPDS 33) Lancet. 1998;352:837–853. - PubMed
-
- Quagliaro L, Piconi L, Assaloni R, Martinelli L, Motz E, Ceriello A. Intermittent high glucose enhances apoptosis related to oxidative stress in human umbilical vein endothelial cells: the role of protein kinase C and NAD(P)H-oxidase activation. Diabetes. 2003;52:2795–2804. - PubMed
LinkOut - more resources
Full Text Sources
Research Materials