Review
. 2015 Oct;88(1054):20150375.
doi: 10.1259/bjr.20150375. Epub 2015 Aug 7.

Nanoparticles and clinically applicable cell tracking

Affiliations
Review

Nanoparticles and clinically applicable cell tracking

Monique R Bernsen et al. Br J Radiol. 2015 Oct.

Abstract

In vivo cell tracking has emerged as a much sought after tool for design and monitoring of cell-based treatment strategies. Various techniques are available for pre-clinical animal studies, from which much has been learned and still can be learned. However, there is also a need for clinically translatable techniques. Central to in vivo cell imaging is labelling of cells with agents that can give rise to signals in vivo, that can be detected and measured non-invasively. The current imaging technology of choice for clinical translation is MRI in combination with labelling of cells with magnetic agents. The main challenge encountered during the cell labelling procedure is to efficiently incorporate the label into the cell, such that the labelled cells can be imaged at high sensitivity for prolonged periods of time, without the labelling process affecting the functionality of the cells. In this respect, nanoparticles offer attractive features since their structure and chemical properties can be modified to facilitate cellular incorporation and because they can carry a high payload of the relevant label into cells. While these technologies have already been applied in clinical trials and have increased the understanding of cell-based therapy mechanism, many challenges are still faced.


Figures

Figure 1.
Figure 1.
Nanoparticle labelling and imaging of cells. Top panels: an electron microscopy (left) and fluorescent microscopy (right) image of human umbilical vein cells labelled with iron oxide nanoparticles and fluorescent Gd–liposomes, respectively, showing intracellular presence of the nanoparticles after labelling procedure. Arrows indicate intracellular deposits of iron oxide nanoparticles. Bottom panels: magnetic resonance images obtained from rats injected subcutaneously with cells labelled with iron oxide particles or Gd–liposomes (liposomes containing gadopentetate dimeglumine in the water phase).
Figure 2.
Figure 2.
Limited signal specificity of the iron oxide-labelled cells injected intramyocardially in a porcine myocardial infarction model. The left panel shows gradient echo scan, before injection of iron oxide-labelled cells. The middle panel shows the same slice after injection with 0.1, 1 or 4 × 106 iron oxide-labelled cells. The right panel shows a similar series of injections in remote, non-infarcted myocardium. Although the cell injections create larger areas of signal voids in the middle panel, their precise location cannot be determined because of the signal voids induced by the presence of haemoglobin degradation products. Bar indicates 0.5 cm. Reprinted from van den Bos et al with permission from Oxford University Press.
Figure 3.
Figure 3.
Monitoring the cellular status of cells by situation-dependent contrast behaviour of Gd. MSCs were labelled with either Gd–liposomes or iron oxide particles and an optical reporter gene (firefly luciferase). Following labelling, cell populations were split in two identical samples. One part was then submitted to repeated freeze-thawing to generate non-viable intact cells. Dual-labelled cells were injected intramuscularly into the lower back of rats, i.e. viable labelled cells on the left side and non-viable cells on the right side. Rats were imaged by MRI (3.0 T) and bioluminescent imaging at several time points over a period of 2 weeks. (a) SPIO–MSCs caused a signal void (hypointensity), regardless of the cell viability. In the acute post-transplantation stage, no substantial differences in visual appearance were detected between viable and non-viable SPIO-MSCs. (b) Viable Gd–MSCs showed a different dynamic signal behaviour compared with non-viable MSCs. Immediately post-transplantation, viable MSCs were consistently detected as a hypointense area on T1 weighted scans (“quenched signal intensity”), whereas a similar density of non-viable Gd–MSCs resulted in increased signal intensity (hyperintensity) at the injection site. In contrast to SPIO–MSCs, hyperintense signal from non-viable Gd–MSCs had already resolved after 2 h post-transplantation. An increased signal intensity on BLI images reflects the cell proliferation that contributed to the tracer dilution observed by MRI.T1W, T1 weighted; T2*W, T2* weighted; BLI, bioluminescence imaging; MSCs, mesenchymal stem cells. Reprinted from Guenoun et al with permission from John Wiley and Sons.
Figure 4.
Figure 4.
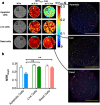
Imaging the functional status of cells by lipoCEST nanosensors. (a) MR images of LipoCEST capsules containing hepatocytes. Shown are magnetization transfer-weighted (MTw) images and magnetization transfer ratio (MTR) asymmetry (MTRasym) maps at 2 ppm of various cell samples. “Apoptotic cells”: LipoCEST capsules containing hepatocytes before (0 h) and after (12 hrs) addition of 50 μM staurosporine. “Live cells”: LipoCEST capsules containing hepatocytes without the addition of staurosporine imaged at time points 0 and 12 h. “Dead cells”: LipoCEST capsules containing hepatocytes treated with STS before encapsulation imaged at time points 0 and 12 h. (b) MTRasym for the three groups at 0 h (open bars) and 12 h (solid bars). (c) Fluorescence overlay images of capsules from the STS and control phantoms shown in (a). Samples are stained for live cells (fluorescein diacetate, green), dead cells (propridium iodide, red) and apoptotic cells (Annexin V, blue). Scale bar = 200 μm. ** indicates statistical significance for the difference in measured values. Reprinted from Chan et al with permission from Nature Publishing Group.
Figure 5.
Figure 5.
In vivo imaging of dendritic cells (DCs) labelled with fluorine-19 (19F) nanoparticles injected intradermally into quadriceps of patients with colorectal cancer. In these patients, approximately 1 × 107 labelled cells were injected. (a) A representative 19F MRS spectrum of patient at 4 h post inoculation. The DCs appear as a single narrow peak. “Reference” is from an external tube containing triflouroacetic acid placed alongside the patient. (b) Axial composite 19F/1H images of the right thigh at 4 h post inoculation in three patients, a 53-year-old female (left), a 45-year-old female (middle) and a 61-year-old male (right), where the DCs are rendered in “hot-iron” pseudocolor and the 1H anatomy is displayed in greyscale (F, femur; RF, rectus femoris; SFA, superficial femoral artery; LN, inguinal lymph node). (c) The results of the in vivo quantification of apparent cell numbers using the 19F MRI data, measured in two patients. By approximately 24 h post inoculation, roughly half of the injected DCs were still present at the injection site. Reprinted from Bonetto et al with permission from John Wiley and Sons.
Figure 6.
Figure 6.
Real-time monitoring of injection accuracy with MRI. (a) Diagram of procedure with pterygopalatine artery left intact. After ligation of external carotid and occipital arteries, common carotid artery was cannulated and SPIO-labelled cells were infused. (b, c) T2* weighted MR images of rat brain and surrounding muscles obtained immediately before (b) and after (c) injection demonstrate that vast majority of cells are localized into extracerebral tissue (arrows), with negligible binding within brain. (d) Diagram of procedure with ligation of pterygopalatine artery. All infused cells were perfused into internal carotid artery and localized successfully into ipsilateral hemisphere. (e, f) MR images obtained immediately before (e) and after (f) injection. Arrows indicate area of cell docking. CA, choroidal anterior artery; CCA, common carotid artery; ECA, external carotid artery; ICA, internal carotid artery; MCA, middle cerebral artery; PA, pterygopalatine artery; PCA, posterior cerebral artery. Reprinted from Gorelik et al with permission from the Radiological Society of North America.

Similar articles

Cited by

References

    1. Fischbach MA, Bluestone JA, Lim WA. Cell-based therapeutics: the next pillar of medicine. Sci Transl Med 2013; 5: 179ps7. doi: 10.1126/scitranslmed.3005568 - DOI - PMC - PubMed
    1. Culme-Seymour EJ, Davie NL, Brindley DA, Edwards-Parton S, Mason C. A decade of cell therapy clinical trials (2000-2010). Regen Med 2012; 7: 455–62. doi: 10.2217/rme.12.45 - DOI - PubMed
    1. Sánchez A, Schimmang T, Garcia-Sancho J. Cell and tissue therapy in regenerative medicine. Adv Exp Med Biol 2012; 741: 89–102. doi: 10.1007/978-1-4614-2098-9_7 - DOI - PubMed
    1. Hawkins RE, Gilham DE, Debets R, Eshhar Z, Taylor N, Abken H, et al. . Development of adoptive cell therapy for cancer: a clinical perspective. Hum Gene Ther 2010; 21: 665–72. doi: 10.1089/hum.2010.086 - DOI - PubMed
    1. Gioviale MC, Bellavia M, Damiano G, Lo Monte AI. Beyond islet transplantation in diabetes cell therapy: from embryonic stem cells to transdifferentiation of adult cells. Transplant Proc 2013; 45: 2019–24. doi: 10.1016/j.transproceed.2013.01.076 - DOI - PubMed