. 2015 Aug 7:5:12870.
doi: 10.1038/srep12870.

Growth differentiation factor-15: a p53- and demethylation-upregulating gene represses cell proliferation, invasion, and tumorigenesis in bladder carcinoma cells

Affiliations

Growth differentiation factor-15: a p53- and demethylation-upregulating gene represses cell proliferation, invasion, and tumorigenesis in bladder carcinoma cells

Ke-Hung Tsui et al. Sci Rep. .

Abstract

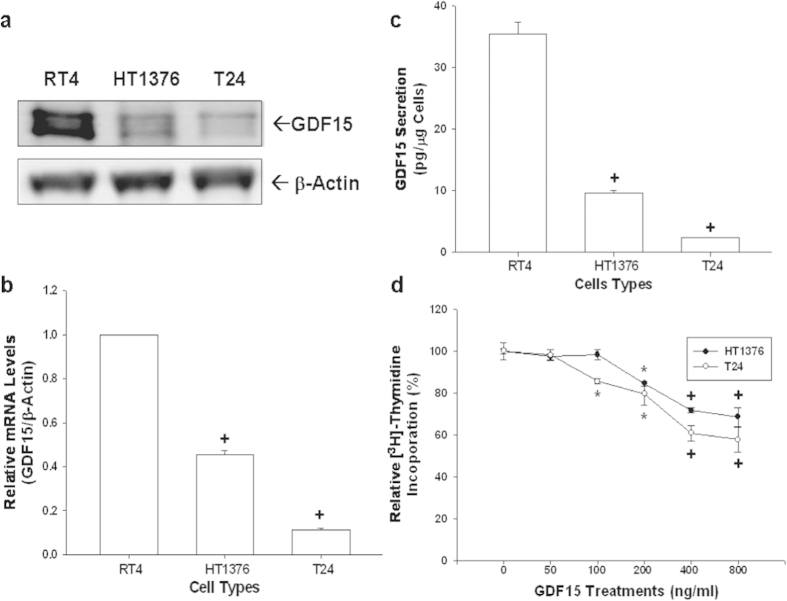
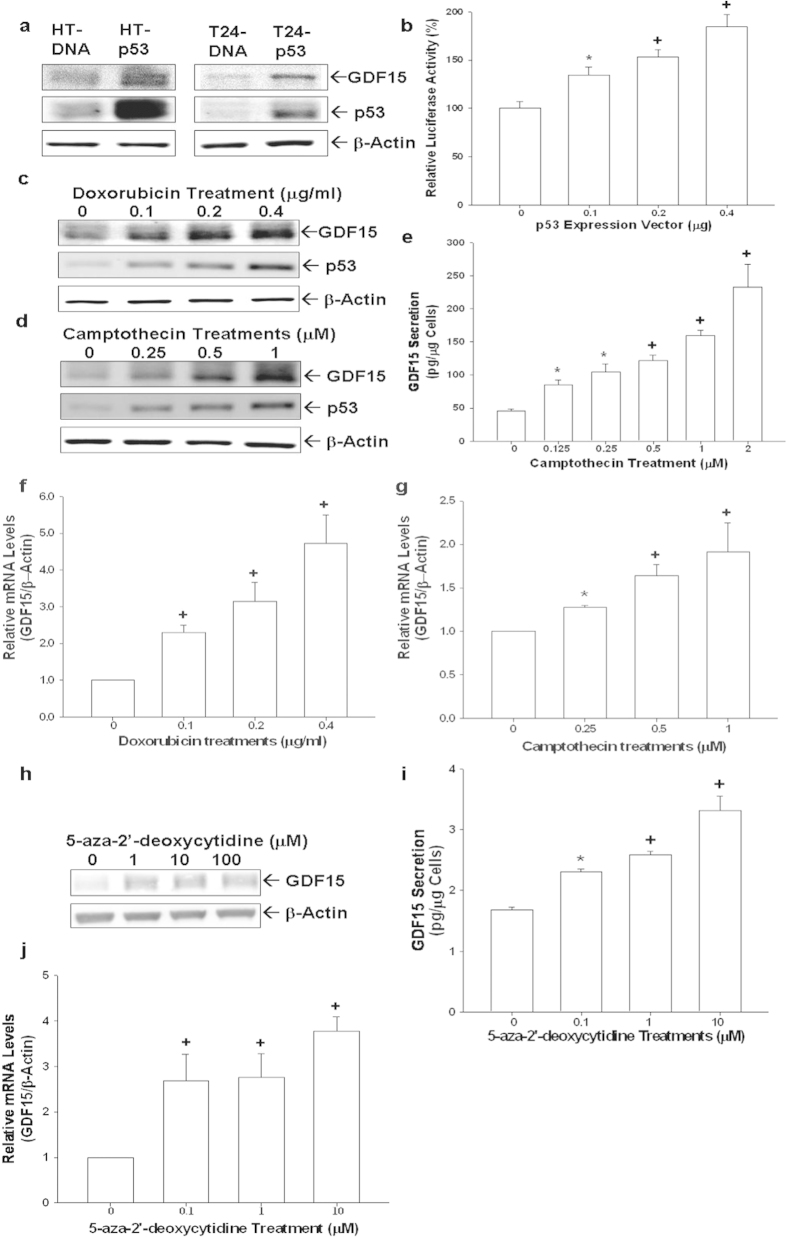
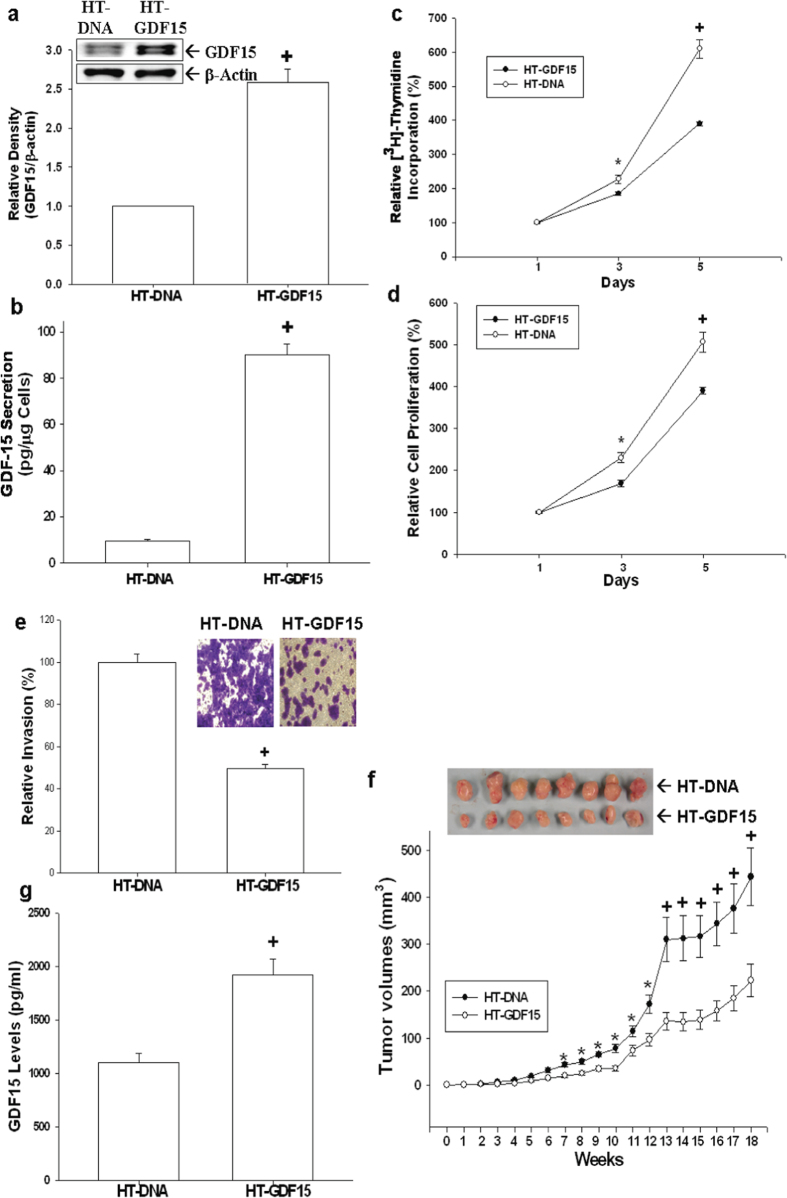
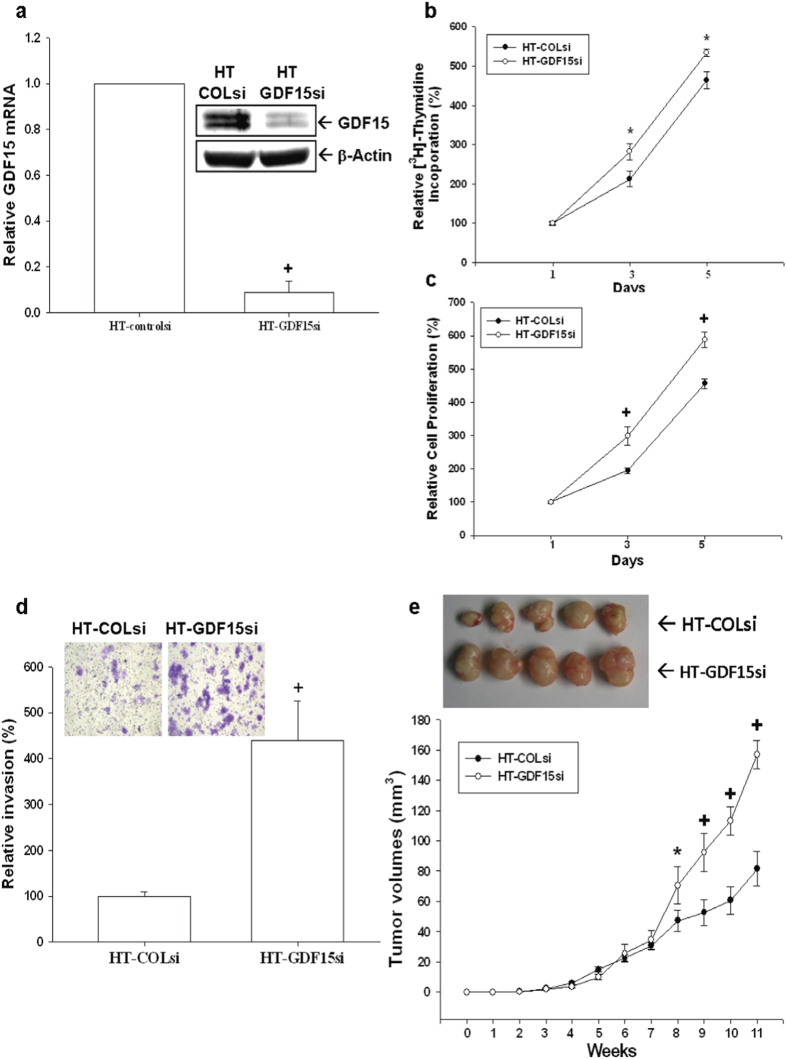
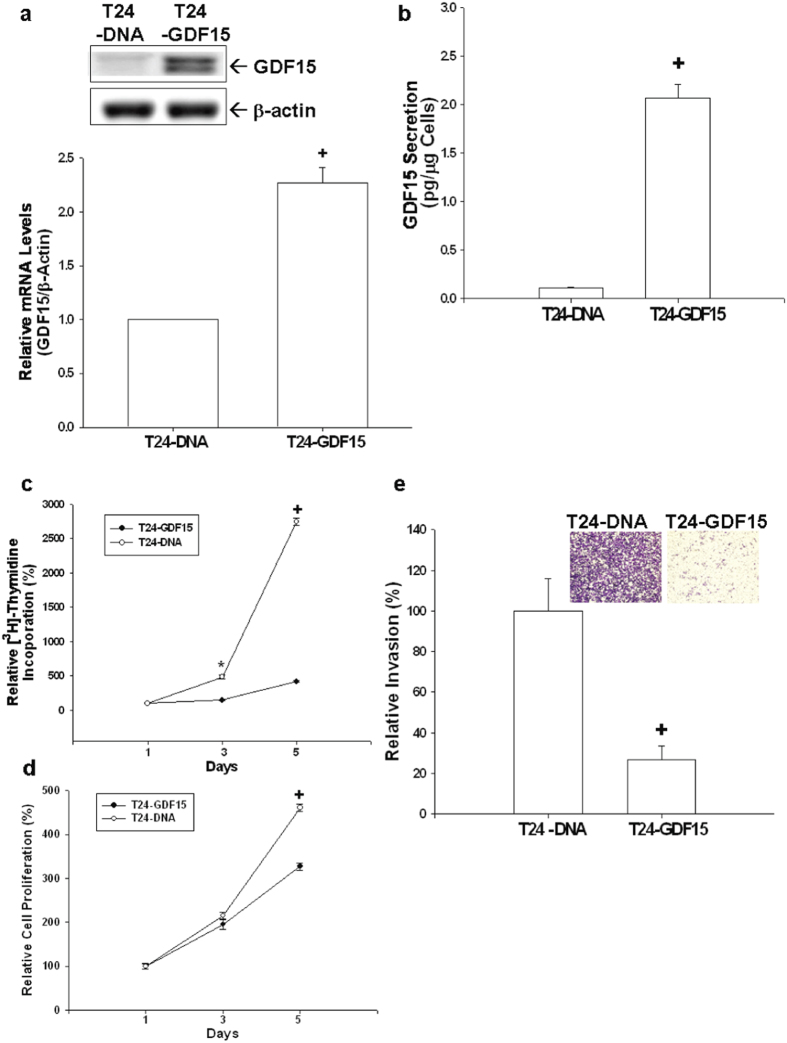
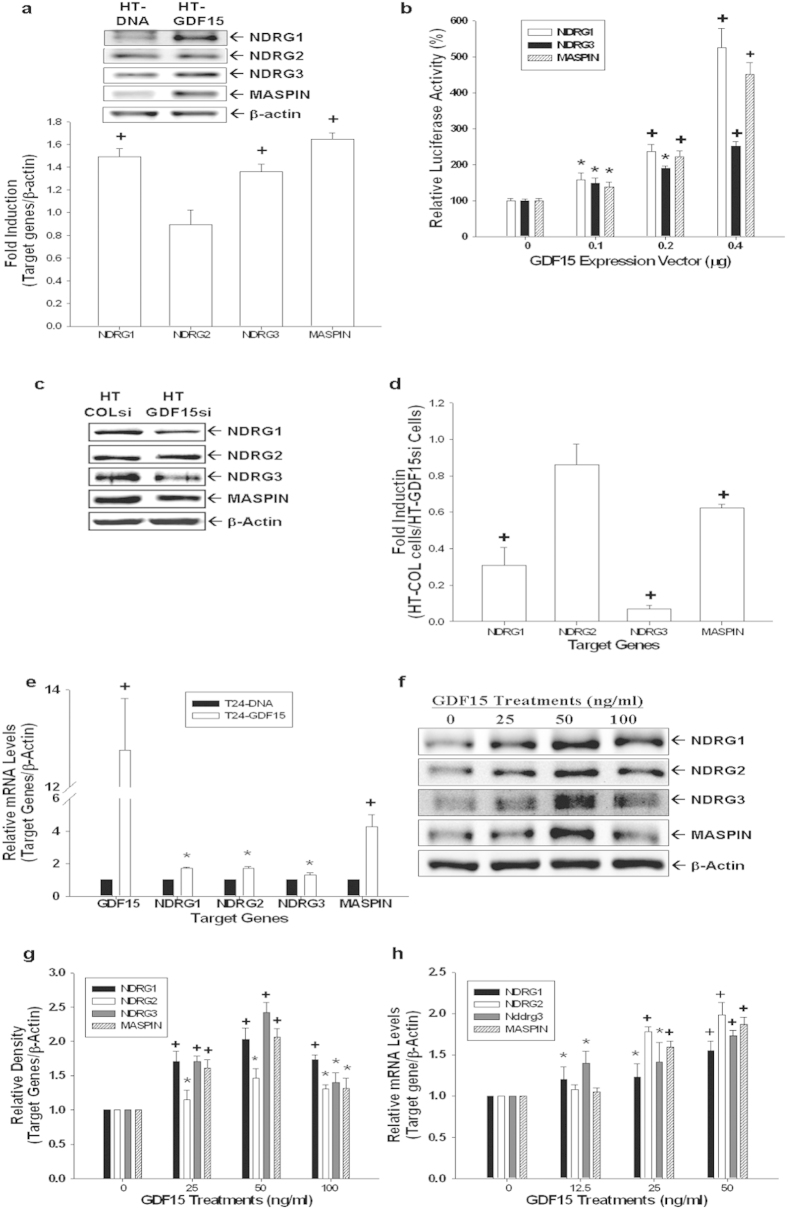
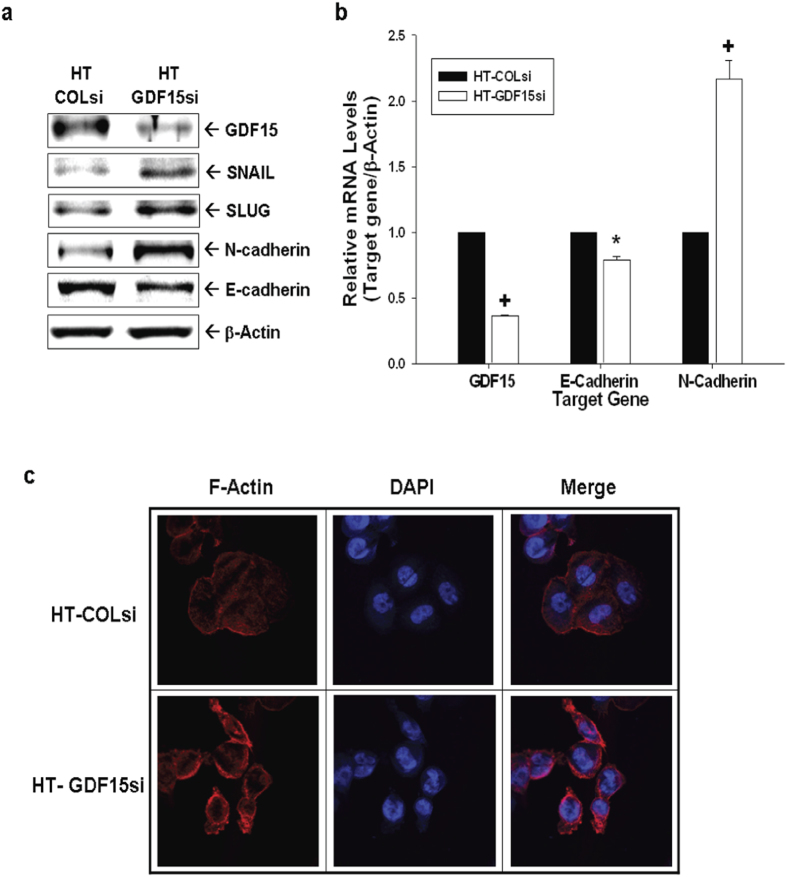
Growth differentiation factor-15 (GDF15), a member of the TGF-β superfamily, affects tumor biology of certain cancers, but remains poorly understood in bladder cancer cells. This study determined the expression, regulation, function, and potential downstream target genes of GDF15 in bladder carcinoma cells. The transitional papilloma carcionoma cells (RT4) expressed higher levels of GDF15 as compared with the bladder carcinoma cells (HT1376 and T24). Treatments of recombinant human GDF15 (rhGDF15) reduced the proliferations of HT1376 and T24 cells. Expression of GDF15 was upregulated via DNA demethylation and p53. The cell proliferation, invasion, and tumorigenesis were reduced in ectopic overexpression of GDF15, while enhanced in GDF15 knockdown. The expressions of mammary serine protease inhibitor (MASPIN) and N-myc downstream-regulated family genes (NDRG1, NDRG2, and NDRG3) were upregulated by GDF15 overexpressions and rhGDF15 treatments in bladder carcinoma cells. GDF15 knockdown induced epithelial-mesenchymal transition (EMT) and F-actin polarization in HT1376 cells. Our results suggest that enhanced expressions of MASPIN and N-myc downstream-regulated family genes and the modulation of EMT may account for the inhibitory functions of GDF15 in the cell proliferation, invasion, and tumorigenesis of bladder carcinoma cells. The GDF15 should be considered as a tumor suppressor in human bladder carcinoma cells.


Figures

Figure 1
Figure 1. Gene expressions of GDF15 in human bladder carcinoma cells and the effect of GDF15 on cell proliferation.
All bladder cells used in this study were serum starved for 24 hours subsequently incubated in RPMI media containing 10% FCS for another 24 hours. (a) Cell proteins were then lysed for immunoblotting assay. (b) Total RNA was extracted from cells for the RT-qPCR assay. Data are presented as mean-fold (±S.E.; n = 3) in relation to that of the RT4 cell group. (c) Conditioned media was collected for ELISA in order to determine the level of GDF15 secretion in the various bladder carcinoma cells. Data is presented as the mean (±S.E.; n = 6) of the GDF15 levels. (d) Proliferation rates in HT1376 (black circle) and T24 (white circle) cells treated with various concentrations of GDF15 were determined by 3H-thymidine incorporation assays. Each point on the curve represents the mean-percentage (±S.E.; n = 6) relative to solvent-treated group (*P < 0.05, +P < 0.01).
Figure 2
Figure 2. Modulation of p53 and demethylation on GDF15 expression in human bladder carcinoma cells.
(a) HT1376 (left) and T24 (right) cells were transiently overexpressed with p53 for 72 hours. The levels of GDF15 and p53 expressions were determined by immunoblotting assays. (b) The GDF15 report vector was co-transfected with various concentrations of p53 expression vector into HT1376 cells for 72 hours. Data are expressed as the mean percentage ± S.E. (n = 6) of luciferase activity relative to mock-transfected groups. Expressions of GDF15 and p53 in RT4 cells following doxorubicin (c) or camptothecin (d) treatments were determined by immunoblotting assays. (e) GDF15 secretion in RT4 cells following camptothecin treatments was determined by ELISA. Data are expressed as mean (±S.E.; n = 6) of the GDF15 levels. Total RNAs were extracted from doxorubicin treated (f) and camptothecin treated RT4 (g) cells for RT-qPCR assays. T24 cells were treated with various concentrations of 5-Aza-2′-deoxycytidine for 48 hours and then GDF15 expression was determined by immunoblotting (h), ELISA (i), and RT-qPCR assays (j). Data are expressed as the mean-fold ± S.E. (n = 3) relative to solvent-treated groups and mean (±S.E.; n = 6) of the GDF15 levels. (*P < 0.05, +P < 0.01).
Figure 3
Figure 3. Effect of GDF15 overexpressed on cell proliferation, invasion, and tumorigenesis in HT1376 cells.
Expressions of GDF15 in HT1376 cells stably transfected with pcDNA3 (HT-DNA) or pcDNA-GDF15 (HT-GDF15) expression vector were determined by immunoblotting assays (a) and ELISA (b). Data are expressed as mean-fold (±S.E.; n = 3) in relation to the HT-DNA cell group and the mean (±S.E.; n = 6) of the GDF15 levels. Proliferations of HT-DNA (white circle) and HT-GDF15 (black circle) cells were determined according to the incorporation of 3H-thymidine (c) and MTS assays (d). Each point on the curve represents the mean-percentage (±S.E.; n = 6) of that on day 1. (e) The invasive ability of cells was determined by in vitro matrigel invasion assays. Data are presented as mean-percentage (±S.E.; n = 3) in relation to that of the HT-DNA cell group. (f) Nude mice were inoculated subcutaneously with HT-DNA (black circle) or HT-GDF15 (white circle) cells. At the indicated days, tumor size was measured using vernier calipers, and results are presented as tumor size in mm3 (±S.E.). (g) Blood samples were collected from experimental animals by cardiocentesis immediately after sacrificed, and GDF15 levels were determined by ELISA. Data is presented as mean (±S.E.; n = 6) of the GDF15 levels. (*P < 0.05, +P < 0.01).
Figure 4
Figure 4. Knockdown of GDF15 enhances cell proliferation and invasion in human bladder carcinoma HT1376 cells.
Expressions of GDF15 in mock-knockdown HT1376 (HT-COLsi) and GDF15 knockdown HT1376 (HT-GDF15si) cells were determined by immunoblotting (a, top) and RT-qPCR (a, bottom) assays. Data are expressed as mean-fold of the GDF15 levels (±S.E.; n = 3) in relation to the HT-COLsi cell group. Proliferations of HT-GDF15si (white circle) and HT-COLsi (black circle) cells were determined according to the incorporation of 3H-thymidine (b) and MTS assays (c). Each point on the curve represents the mean-percentage (±S.E.; n = 6) of that on day 1. (d) Invasive ability of cells was determined by the in vitro matrigel invasion assays. Data are presented as mean-percentage (±S.E.) in relation to the HT-COLsi cell group. (e) Nude mice were inoculated subcutaneously with HT-COLsi (black circle) or HT-GDF15si (white circle) cells. Tumor size as measured using vernier calipers. Results are presented as tumor size in mm3 (±S.E.), which measured at the indicated time intervals. (*P < 0.05, +P < 0.01).
Figure 5
Figure 5. Effects of GDF15 overexpressed on cell proliferation and invasion in T24 cells.
Expressions of GDF15 in T24 cells transfected with pcDNA3 (T24-DNA) or pcDNA-GDF15 (T24-GDF15) expression vector were determined by immunoblotting assays (a, top), RT-qPCR assays (a, bottom) and ELISA (b). Data are expressed as mean-fold (±S.E.; n = 3) in relation to the T24-DNA cell group and the mean (±S.E.; n = 6) of the GDF15 levels. Cell proliferations in T24-DNA (white circle) and T24-GDF15 (black circle) were determined according to 3H-thymidine incorporation (c) and MTS assays (d). Each point on the curve represents the mean-percentage (±S.E.; n = 6) of that on day 1. (e) The invasive ability of cells was determined by the in vitro matrigel invasion assays. Data are presented as the mean-percentage (±S.E.) in relation to that of the T24-DNA cell group. (*P < 0.05, +P < 0.01).
Figure 6
Figure 6. Modulation of GDF15 on the expressions of MASPIN, NDRG1, NDRG2, and NDRG3 genes in bladder carcinoma cells.
(a) Differences in expressions of NDRG1, NDRG2, NDRG3, and MASPIN between HT-DNA and HT-GDF15 cells were determined by immunoblotting assays. Data of quantitative analysis are expressed as the intensity of the protein bands produced from the target gene/β-actin (±S.E.; n = 3) of HT-GDF15 cells relative to that of the HT-DNA group. (b) The reporter vectors of NDRG1, NDRG3, and MASPIN were cotransfected with various concentrations of GDF15 expression vectors into HT1376 cells for 72 hours. Data are expressed as the mean percentage ± S.E. (n = 6) relative to the mock-transfected groups. Expressions of GDF15, NDRG1, NDRG2, NDRG3, and MASPIN in mock-knockdown HT1376 (HT-COLsi) and GDF15-knockdwon HT1376 (HT-GDF15si) cells were determined by immunoblotting (c) and RT-qPCR (d) assays. Data are presented as mean-fold (±S.E.) in relation to the HT-COLsi cell group. (e) Differences in the expressions of GDF15, NDRG1, NDRG2, NDRG3, and MASPIN genes between T24-DNA and T24-GDF15 cells were determined by RT-qPCR assays. Data are presented as mean-fold (±S.E.) in relation to the T24-DNA cell group. Differences in the expressions of NDRG1, NDRG2, NDRG3, and MASPIN genes following treatments with various concentrations of rhGDF15 were determined by immunoblotting (f) and RT-qPCR (h) assays. Data of quantitative analysis are expressed as the intensity of the protein bands produced from the target gene/β-actin (±S.E.; n = 3) relative to that of the solvent-control group (g). (*P < 0.05, +P < 0.01).
Figure 7
Figure 7. Expression of GDF15 modulates the expression of epithelial-mesenchymal transition markers in human HT1376 cells.
(a) Expression levels of SNAIL, SLUG, E-cadherin, and N-cadherin in HT-GDF15si and HT-COLsi cells were determined by immunoblotting assays. (b) Expressions of GDF15, E-cadherin, and N-cadherin in HT-GDF15si (white bars) and HT-COLsi (black bars) cells were determined by RT-qPCR assays. Data are presented as mean-fold (±S.E.) in relation to the HT-COLsi cell group. (c) Distribution of F-actin (red) between HT-GDF15si and HT-COLsi cells was determined by immunofluorescence staining. DAPI (blue) was applied to stain the nucleus. (*P < 0.05, +P < 0.01).

Similar articles

Cited by

References

    1. Siegel R., Naishadham D. & Jemal A. Cancer statistics, 2013. CA Cancer J Clin 63, 11–30 (2013). - PubMed
    1. Schned A. R. et al. Histological classification and stage of newly diagnosed bladder cancer in a population-based study from the Northeastern United States. Scand J Urol Nephrol 42, 237–242 (2008). - PMC - PubMed
    1. Mitra A. P. & Cota R. J. Molecular pathogenesis and diagnostics of bladder cancer. Annu Rev Pathol 4, 251–285 (2009). - PubMed
    1. Goodison S., Rosser C. J. & Urquidi V. Bladder cancer detection and monitoring: assessment of urine- and blood based marker tests. Mol Diag Ther 17, 71–84 (2013). - PMC - PubMed
    1. Ghafouri-Fard S., Nekoohesh L. & Motevaseli E. Bladder cancer biomarkers: Review and update. Asian Pac J Cancer Prev 15, 2395–2403 (2014). - PubMed

Publication types

MeSH terms

Substances