Comparative Study
. 2015 Dec;63(12):2340-61.
doi: 10.1002/glia.22898. Epub 2015 Aug 6.

Astrocyte reactivity after brain injury-: The role of galectins 1 and 3

Affiliations
Comparative Study

Astrocyte reactivity after brain injury-: The role of galectins 1 and 3

Swetlana Sirko et al. Glia. 2015 Dec.

Abstract

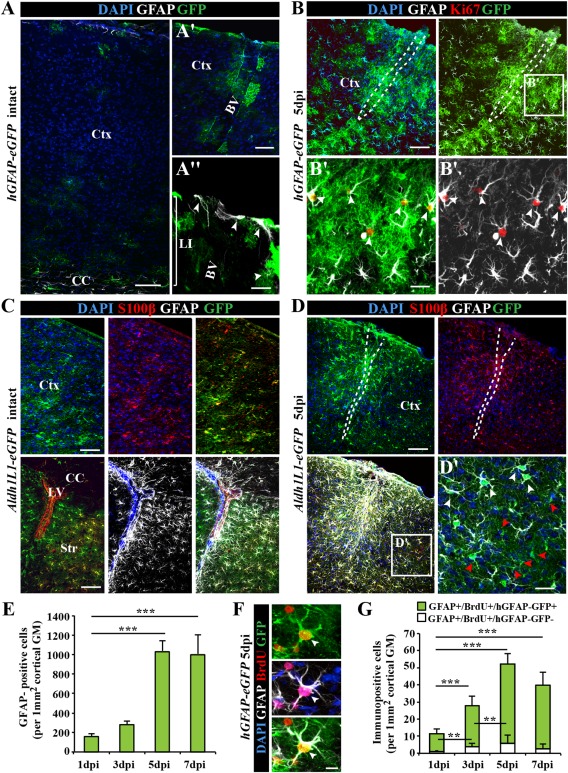
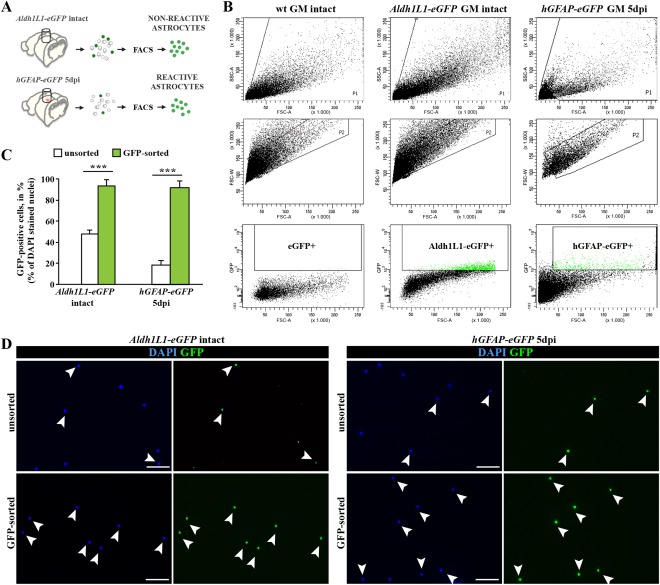
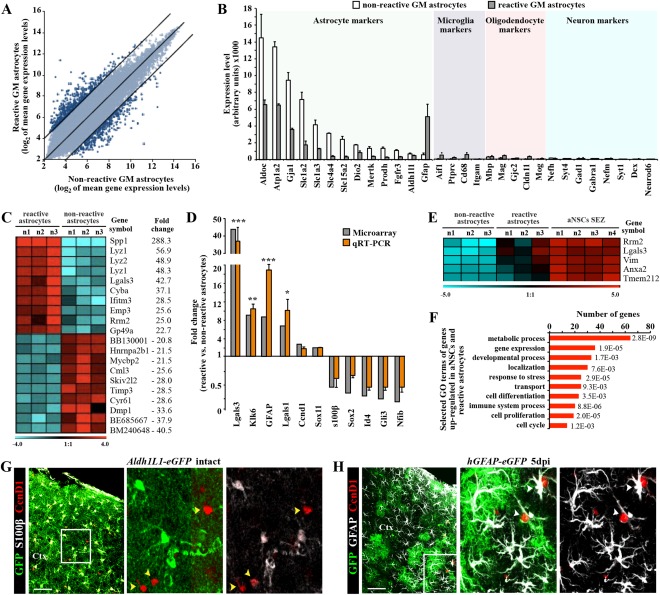
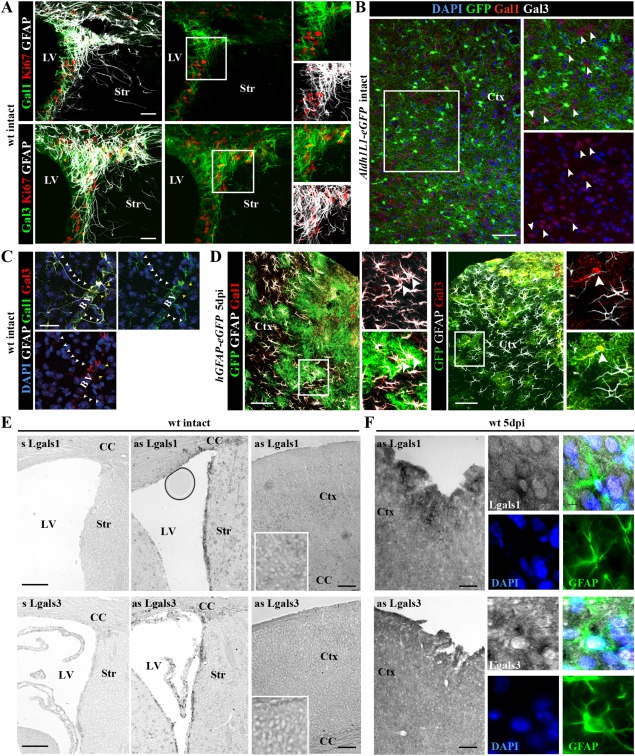
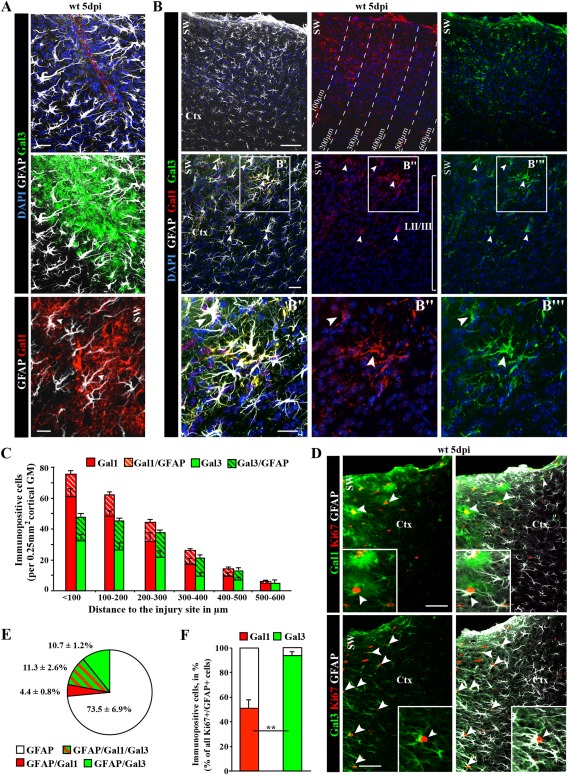
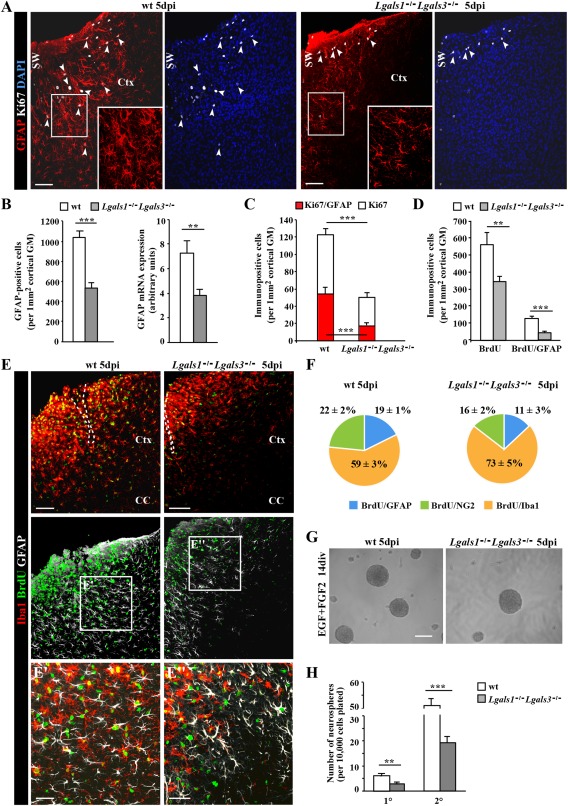
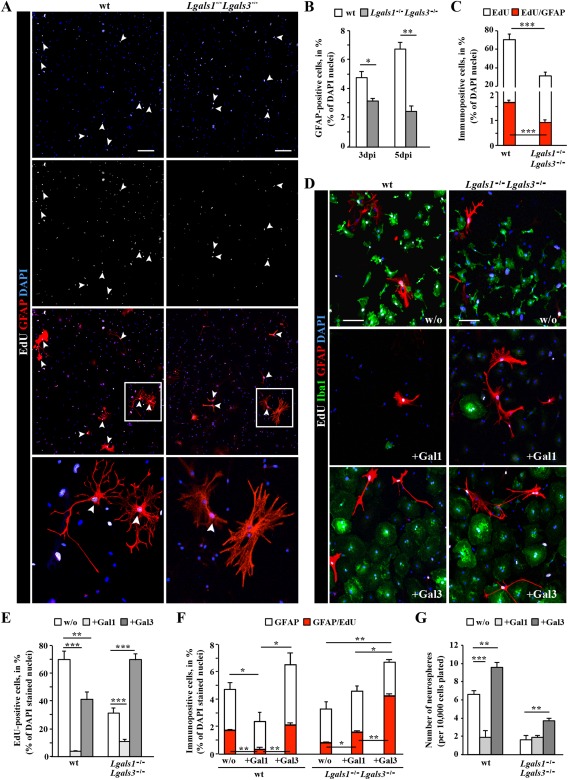
Astrocytes react to brain injury in a heterogeneous manner with only a subset resuming proliferation and acquiring stem cell properties in vitro. In order to identify novel regulators of this subset, we performed genomewide expression analysis of reactive astrocytes isolated 5 days after stab wound injury from the gray matter of adult mouse cerebral cortex. The expression pattern was compared with astrocytes from intact cortex and adult neural stem cells (NSCs) isolated from the subependymal zone (SEZ). These comparisons revealed a set of genes expressed at higher levels in both endogenous NSCs and reactive astrocytes, including two lectins-Galectins 1 and 3. These results and the pattern of Galectin expression in the lesioned brain led us to examine the functional significance of these lectins in brains of mice lacking Galectins 1 and 3. Following stab wound injury, astrocyte reactivity including glial fibrillary acidic protein expression, proliferation and neurosphere-forming capacity were found significantly reduced in mutant animals. This phenotype could be recapitulated in vitro and was fully rescued by addition of Galectin 3, but not of Galectin 1. Thus, Galectins 1 and 3 play key roles in regulating the proliferative and NSC potential of a subset of reactive astrocytes.

Keywords: genomewide analysis; glia proliferation; neurosphere.


Figures

Figure 1
Figure 1
Characterization of astrocytes in the intact and injured somatosensory cortex. (A) Fluorescence micrographs of GFP immunoreactivity in the intact somatosensory cortex of hGFAP‐eGFP mice at postnatal day (P65). Note that GFP is limited to few subpial astrocytes in the cortical layer I (LI) or parenchymal astrocytes in the vicinity of blood vessels (BV) in the intact cerebral cortex (Ctx). (B) After stab wound injury of hGFAP‐eGFP mice of the same age, GFP was found in virtually all GFAP+ reactive astrocytes including proliferating (Ki67+) reactive astrocytes (white arrowheads in B′). (C) Fluorescence micrographs depict representative confocal images of GFP immunostaining in the intact cerebral cortex (upper panel) of Aldh1L1eGFP transgenic mice. Double‐immunopositive cells for the calcium binding protein S100β in the intact gray matter (GM) and GFAP in the intact corpus callosum (CC), striatum (Str) and subependymal layer of lateral ventricle (LV) (lower panel). (D) Stab wound injury of Aldh1L1eGFP somatosensory GM induces a broad expression of GFAP in many (white arrowhead), but not all GM astrocytes (red arrowheads) at the injury site (D′). (E) Histogram depicting the number of the hGFAP‐GFP+ astrocytes in the penumbra of the injury increasing significantly over the first 7 dpi. (F) Fluorescence micrograph shows labeling for the DNA base analog BrdU (given ×1 i.p. 2 h before immunohistological processing) in GFP+ and GFAP+ astrocytes 5 dpi in hGFAP‐eGFP mouse cerebral cortex GM. (G) Quantification of the number of such cells is shown in the histogram with a significant increase within the first 5 dpi. All data are plotted as mean ± SEM from n = 5 experiments. Significance between means was analyzed using of one‐way ANOVA test and indicated as *(P < 0.05), **(P < 0.01), ***(P < 0.001). Scale bars: (A–D) 100 μm, (A′) 50 μm, (B′, D′) 25 μm, (A″, F) 10 μm.
Figure 2
Figure 2
Purification of astrocytes from the intact and injured somatosensory cortex GM using fluorescence‐activated cell sorting (FACS). (A) Schematic representation of experimental design used for the tissue dissection and purification of astrocytes from intact or stab wound‐injured cerebral cortex GM. (B) FACS plots show the sorting gates that were used in hierarchical way for isolation of astrocytes, based on cell size (forward scatter, FSC) and granularity (side scatter, SSC) (upper layer), discrimination of doublets (FSC‐area vs. FSC‐width; middle layer) and positive selection for GFP+ cells (lower layer). (C) Bar graphs depict proportions of GFP+ astrocytes before (unsorted) and after FACS sorting (GFP‐sorted), indicating high efficiency of the sorting procedure. (D) Purity of sorting cell populations was confirmed by immunostaining of cells before (unsorted) and after FACS sorting (sorted). All data are plotted as mean ± SEM from n ≥ 5 experiments. Significance between means from two experimental groups was analyzed using of two‐tailed unpaired Student's t‐test and indicated as *(P < 0.05), **(P < 0.01), ***(P < 0.001). Scale bars: (D) 75 μm
Figure 3
Figure 3
Genomewide expression analysis of astrocytes from the intact or injured cerebral cortex GM. (A) Scatter plot of whole genome expression profile in nonreactive (Aldh1L1‐eGFP) and reactive (hGFAP‐eGFP) astrocytes depicted at normalized expression levels of all probe sets from the Affymetrix GeneChip Mouse Genome 430 2.0 arrays presented on log2 scale. Black lines indicated boundaries of twofold difference in gene expression levels. (B) Both isolated astrocyte populations express high level of astroglia‐specific genes. The y‐axis represents normalized expression of probe sets for cell‐type‐specific markers from the array. (C) Heat map showing the top 20 genes that significantly differ between astrocytes from intact or injured cerebral cortex (the normalized values are plotted on a log2 color scale, and color indicates up‐ (red) and downregulation (blue), as compared with the mean and linear fold changes (reactive vs. nonreactive astrocytes) are provided). (D) Transcript levels of several genes were confirmed by quantitative RT‐PCR and are shown in comparison to GeneChip expression levels. Data are plotted as mean ± SEM from independent biological/technical replicates. Significance between experimental groups was analyzed using of two‐tailed unpaired Student's t‐test and indicated as *(P < 0.05), **( P < 0.01), ***( P < 0.001). (E) The top five genes significantly enriched in both reactive astrocyte and adult neural stem cells (aNSC SEZ; see Beckervordersandforth et al., 2010) in comparison to the non‐reactive astrocytes are shown as a heat map as described above (for complete list, see Table 2). (F) Bars show 10 selected major GO classes associated with genes significantly enriched in both reactive astrocytes and aNSCs. (G, H) Immunofluorescence for cyclin D1 (in red) in frontal sections of intact (G) or injured (5 dpi, H) cerebral cortex confirm the injury‐induced expression of cyclin D1 (Ccnd1) in reactive astrocytes (white arrowheads), while astrocytes in the intact GM do not express cyclin D1 (yellow arrowheads). The cell nuclei were counterstained with DAPI. Scale bars: (G, H) 100 μm.
Figure 4
Figure 4
Injury‐induced expression of Galectins 1 and 3 in parenchymal astrocytes of the adult cortical GM. (A) In the intact forebrain, expression of Galectin‐1 (Gal‐1) (upper panels) or Galectin‐3 (Gal‐3) (lower panels) is restricted to the adult SEZ at the lateral ventricle (LV), where these lectins labeled also proliferating GFAP+ cells shown in the inserts to the right. (B) In the intact cerebral cortex, Gal‐3‐immunostaining is virtually not detectable, while Gal‐1 is occasionally associated with Aldh1L1‐eGFP‐negative neurons (white arrowheads). (C) Only few GFAP‐positive astrocytes were Gal‐1‐ and/or Gal‐3‐immunoreactive in the intact cerebral cortex and these were located in the perivascular surroundings (BV, blood vessels). (D) In the stab wound‐injured cerebral cortex, many hGFAP‐eGFP/GFAP‐positive astrocytes are Gal‐1+ or Gal‐3+ (white arrowheads) at 5 dpi. (E, F) Combined ISH and immunohistochemistry on frontal sections from intact (E) or injured (right panels) forebrains using an anti‐GFAP antibody and RNA probes for Lgals1 and Lgals3 transcripts show increased Lgals1/3 expression after injury (F) and co‐localization with GFAP (panels at higher magnification in F). The cell nuclei were counterstained with DAPI. Scale bars: (B, D, E, F) 100 μm, (A, C) 50 μm.
Figure 5
Figure 5
Galectin‐1/‐3 labels subsets of reactive astrocytes in the injured cortical GM. (A, B) Fluorescence micrographs depicting the stainings indicated on the left side of the panels show localization of Gal‐1 and Gal‐3 immunoreactivity in many cells, including a subset of reactive astrocytes (GFAP‐co‐labelling in A, B). (C) Histogram depicting the number of Gal‐1+ and Gal‐3+ cells or astrocytes at different distance to the injury site as indicated in B. Data are plotted as mean ± SEM from n ≥ 5 experiments. (D) Co‐localization with Ki67 and GFAP (white arrowheads) reveals that the subset of astrocytes double‐positive for Gal‐1 or Gal‐3 (for quantification, see pie chart in E) are all (Gal‐3; arrowheads) or most (Gal‐1; arrowheads) Ki67+ (for quantification in histogram see F). Data are plotted as mean ± SEM from n = 5 experiments. Significance was analyzed using of two‐tailed unpaired Student's t‐test and indicated as *(P < 0.05), **(P < 0.01), ***(P < 0.001). The cell nuclei were counterstained with DAPI. Scale bars: (B) 100 μm, (D) 75 μm, (B′–B″′) 50 μm, (A) 25 μm.
Figure 6
Figure 6
Reduced number and proliferation of reactive astrocytes in the stab wound‐injured cortical GM of Lgals1 −/− Lgals3 −/− mice. (A) Representative overview images shown distribution of proliferating reactive astrocytes (GFAP+/Ki67+, arrowheads) in the penumbra of the stab wound injury in the cerebral cortex of wild type (wt) and Lgals1 −/− Lgals3 −/− mice. The boxed regions are shown at higher magnification. (B) Quantification of the number of GFAP+ astrocytes (left histogram) and quantitative RT‐PCR analysis of GFAP mRNA (right histogram) showed significant reduction in the number of GFAP+ cells and GFAP mRNA levels in the cerebral cortex GM at 5 days after stab wound injury in Lgals1 −/− Lgals3 −/− mice compared with wt. (C) Quantification of cells (white bars) and astrocytes (red bars) proliferating (Ki67+) at 5 dpi revealed a significant reduction of both in Lgals1 −/− Lgals3 −/− compared with wt mice. (D) Quantification of cells (left bars) or astrocytes (GFAP/BrdU, right bars) proliferating at any time after stab wound injury labeled by BrdU given during these 5 dpi also revealed a significant decrease in proliferating cells and astrocytes (to less than 20% of the control) at the injury site of Lgals1 −/− Lgals3 −/− compared with wt cerebral cortex GM. (E) Micrograph showing reduced proliferative activity of microglial cells (BrdU+/Iba+) after stab wound injury in Lgals1 −/− Lgals3 −/− compared with wt cerebral cortex GM. (F) Pie chart depicting the composition of all cells proliferating within 5 dpi labeled by BrdU in wt (left) and Lgals1 −/− Lgals3 −/− (right) cerebral cortex GM. Note that macroglial cells are affected most. (G, H) Neurosphere formation (micrographs in G) of cells isolated at 5 dpi from the GM surrounding the injury site was significantly reduced for both primary (1°) and secondary (2°) neurospheres from Lgals1 −/− Lgals3 −/− compared with wt mice. Data are plotted as mean ± SEM from n ≥ 5 experiments. Significance between experimental groups was analyzed using of two‐tailed unpaired Student's t‐test and indicated as *(P < 0.05), **(P < 0.01), ***(P < 0.001). The cell nuclei were counterstained with DAPI. Scale bars: (A, E, G) 100 μm, (E′, E″) 50 μm.
Figure 7
Figure 7
In vitro addition of Galectin 3, but not Galectin 1 promotes adult reactive glia proliferation, neurosphere formation and rescues the Lgals1 −/− Lgals3 −/− reactive glia phenotype. (A) Fluorescence micrographs of cells stained for EdU (added at 2 div) and GFAP in adherent cultures derived at 3 dpi from the injured cerebral cortex GM of wt or Lgals1 −/− Lgals3 −/− mice. Note the double‐labeled reactive astrocytes proliferating during the 4 days in culture after EdU addition (white arrowheads). The boxed regions are shown at higher magnification. (B, C) Histograms depicting the percent of GFAP+ cells (B, percent of DAPI+ cells), proliferating (EdU+, white in C) or proliferating GFAP+ cells (red in C) in the above cultures isolated at 3 or 5 dpi (as indicated on the x‐axis) from wt and Lgals1 −/− Lgals3 −/− cerebral cortex GM. Note that approximately twice as many astrocytes are proliferating among wt cells compared with Lgals1 −/− Lgals3 −/− cells, indicating a cell autonomous effect. Data are plotted as mean ± SEM from n = 5 experiments. (D–G) In vitro addition of Gal‐1 or Gal‐3 as indicated in the fluorescence micrograph panels (D) or the histograms (E‐G). For experiments shown in D‐F, Gal‐1 (+Gal‐1) or Gal‐3 (+Gal‐3) were added 1× and cells were fixed without further medium change 4 days later, stained for GFAP and Iba1 in combination with EdU labeling, as shown in the micrograph in (D) and quantified as indicated in (E, F). Note the differential effect of Gal‐1 addition, which largely mediated cell death versus Gal‐3 addition, which promoted proliferation of cells (E) and fully rescued the defective proliferation of Lgals1 −/− Lgals3 −/− cells (E, F). (G) The total number of primary neurospheres generated from wt or Lgals1 −/− Lgals3 −/− reactive glia, plated in the growth factors‐containing medium for 14 days with addition of Gal‐1 or Gal‐3. Note, that the number of spheres obtained from the Gal‐3‐treated wt or Lgals1 −/− Lgals3 −/− reactive glia was significantly increased in comparison to control cultures (w/o). All data are plotted as mean ± SEM from n = 5 experiments. Significance between experimental groups was analyzed using of two‐tailed unpaired Student's t‐test (in A, C, F) or one‐way ANOVA test (in E, G) and indicated as *(P < 0.05), **(P < 0.01), ***(P < 0.001). The cell nuclei were counterstained with DAPI. Scale bars: (A) 100 μm, (D) 50 μm.

Similar articles

Cited by

References

    1. Anderson MA, Ao Y, Sofroniew MV. 2014. Heterogeneity of reactive astrocytes. Neurosci Lett 565:23–29. - PMC - PubMed
    1. Astorgues‐Xerri L, Riveiro ME, Tijeras‐Raballand A, Serova M, Neuzillet C, Albert S, Raymond E, Faivre S. 2014. Unraveling galectin‐1 as a novel therapeutic target for cancer. Cancer Treat Rev 40:307–319. - PubMed
    1. Bardehle S, Krüger M, Buggenthin F, Schwausch J, Ninkovic J, Clevers H, Snippert HJ, Theis FJ, Meyer‐Luehmann M, Bechmann I, Dimou L, Götz M. 2013. Live imaging of astrocyte responses to acute injury reveals selective juxtavascular proliferation. Nat Neurosci 16:580–586. - PubMed
    1. Barnes EA, Kong M, Ollendorff V, Donoghue DJ. 2001. Patched1 interacts with cyclin B1 to regulate cell cycle progression. Embo J 20:2214–23. - PMC - PubMed
    1. Beckervordersandforth R, Tripathi P, Ninkovic J, Bayam E, Lepier A, Stempfhuber B, Kirchhoff F, Hirrlinger J, Haslinger A, Lie DC, Beckers J, Yoder B, Irmler M, Götz M. 2010. In vivo fate mapping and expression analysis reveals molecular hallmarks of prospectively isolated adult neural stem cells. Cell Stem Cell 7:744–758. - PubMed

Publication types

MeSH terms