. 2015 Aug 7:16:244.
doi: 10.1186/s12859-015-0686-x.

InteMAP: Integrated metagenomic assembly pipeline for NGS short reads

Affiliations

InteMAP: Integrated metagenomic assembly pipeline for NGS short reads

Binbin Lai et al. BMC Bioinformatics. .

Abstract

Background: Next-generation sequencing (NGS) has greatly facilitated metagenomic analysis but also raised new challenges for metagenomic DNA sequence assembly, owing to its high-throughput nature and extremely short reads generated by sequencers such as Illumina. To date, how to generate a high-quality draft assembly for metagenomic sequencing projects has not been fully addressed.

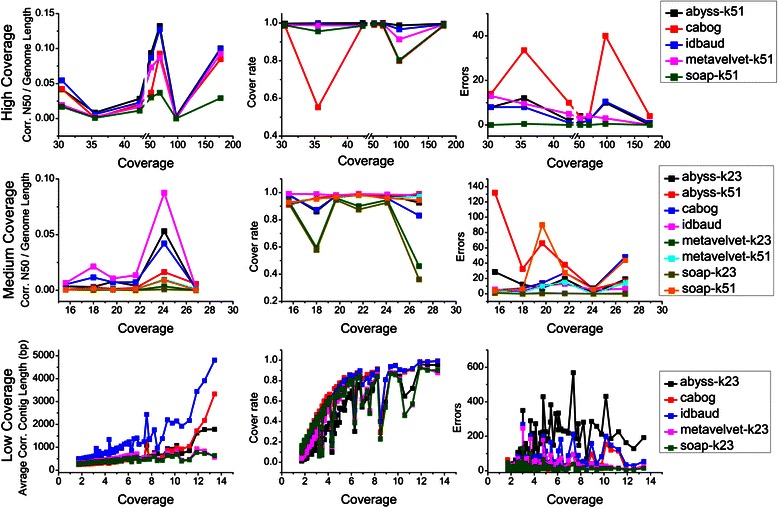
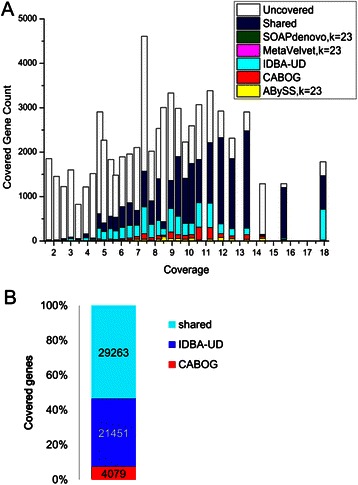
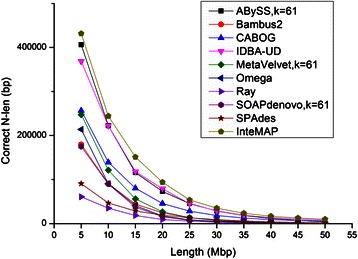
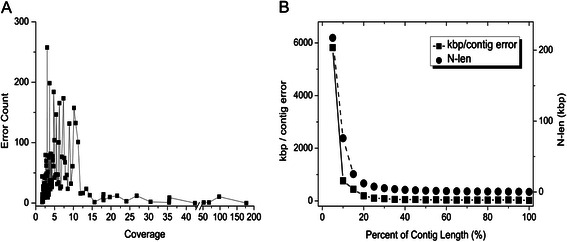
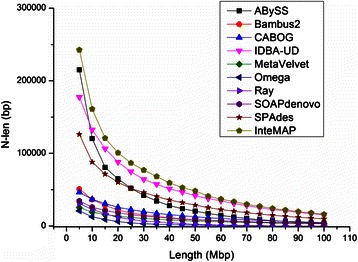
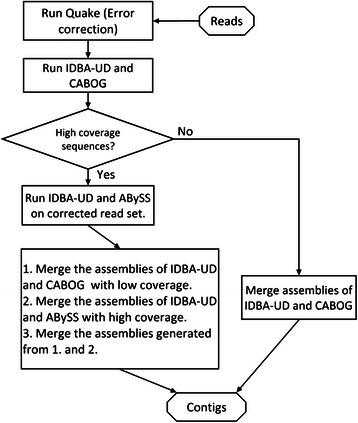
Results: We conducted a comprehensive assessment on state-of-the-art de novo assemblers and revealed that the performance of each assembler depends critically on the sequencing depth. To address this problem, we developed a pipeline named InteMAP to integrate three assemblers, ABySS, IDBA-UD and CABOG, which were found to complement each other in assembling metagenomic sequences. Making a decision of which assembling approaches to use according to the sequencing coverage estimation algorithm for each short read, the pipeline presents an automatic platform suitable to assemble real metagenomic NGS data with uneven coverage distribution of sequencing depth. By comparing the performance of InteMAP with current assemblers on both synthetic and real NGS metagenomic data, we demonstrated that InteMAP achieves better performance with a longer total contig length and higher contiguity, and contains more genes than others.

Conclusions: We developed a de novo pipeline, named InteMAP, that integrates existing tools for metagenomics assembly. The pipeline outperforms previous assembly methods on metagenomic assembly by providing a longer total contig length, a higher contiguity and covering more genes. InteMAP, therefore, could potentially be a useful tool for the research community of metagenomics.


Figures

Fig. 1
Fig. 1
Assembly performances on the simulated metagenome dataset for the five assemblers. Assembly performances on the simulated metagenome dataset for the five assemblers (ABySS (k-mer size 51), CABOG, IDBA-UD, MetaVelvet (k-mer size 51), and SOAPdenovo (k-mer size 51)) are shown. The left column draws the ratio of correct N50 size to genome length, the medium column draws the assembly cover rate and the right column draws the assembly error counts of the assemblies. The top panel reports the performances for data at the high-coverage level (≥30×), while the medium panel does at the medium-coverage level (15-30×), and the bottom panel does at the low-coverage level (<15×)
Fig. 2
Fig. 2
Genes covered by different assemblies. a The number of genes uncovered by any assemblies, covered by more than one assemblies and covered exclusively by only one assembly of the five assemblers (ABySS (k-mer size 23), CABOG, IDBA-UD, MetaVelvet (k-mer size 23), SOAPdenovo (k-mer size 23)), for the species with low coverage (<18×) are stacked. The lateral axis shows the coverage of each species. Only partial species with coverage lower than 18× are drawn. b The stacked bar plot draws the distribution of the total genes on species with low coverage (<18×) covered by IDBA-UD assembly and CABOG assembly. The blue part and the cyan part represent genes covered exclusively by CABOG and IDBA-UD, and the magenta part represents the genes shared by CABOG and IDBA-UD
Fig. 3
Fig. 3
N-len size plot for assemblies on the sim-113sp dataset
Fig. 4
Fig. 4
The error profile of InteMAP assembly on the sim-113sp dataset. a The Error counts for each species from the InteMAP assembly on the sim-113sp dataset are shown. The lateral axis shows the coverage of the species. b The square dot with solid line reflects the average error rate within the subsets of contigs with different intervals of length which were generated as follows. We sorted the contigs by the descending order of length and partitioned the set of ordered contigs into subsets so that the aggregated length of contigs in each subset equaled to or approximated to 5 % of the total length. The error rate is measured as the average distance between errors on each subset of the contigs. The error rate (left vertical axis) is plotted versus the quantile of the total length (lateral axis) at which the set of contigs are partitioned. The circle dot with dash line draws N-len size (right vertical axis) at the aggregate length points (percentage of the total length is shown on lateral axis)
Fig. 5
Fig. 5
N-len size plot for assemblies on real NGS dataset (sample MH0012)
Fig. 6
Fig. 6
The flowchart of the main procedures of the InteMAP pipeline
Fig. 7
Fig. 7
Illustration of merging two assemblies. a Two types of breakpoints caused by differences between two assemblies are illustrated. Suppose two assemblies asm1 and asm2 have the same assembled sequence segment seg1. The first type of difference is that in asm1, seg1 is extended with seg2 on the right, while in asm1, seg1 ends on the right. The second type of difference is that in ass1, seg1 is extended with seg2 on the right, while in asm2, seg1 is extended with seg3 on the right. b Split the contigs at the breakpoint within the suspicious region. c An example of merging the segments at the breakpoints which are not broken

References

    1. Venter JC, Remington K, Heidelberg JF, Halpern AL, Rusch D, Eisen JA, et al. Environmental genome shotgun sequencing of Sargasso sea. Science. 2004;304:66–74. doi: 10.1126/science.1093857. - DOI - PubMed
    1. Qin J, Li R, Raes J, Arumugam M, Burgdorf KS, Manichanh C, et al. A human gut microbial gene catalogue established by metagenomic sequencing. Nature. 2010;464:59–64. doi: 10.1038/nature08821. - DOI - PMC - PubMed
    1. Emmanuelle LC, Trine N, Junjin Q, Edi P, Falk H, Gwen F, et al. Richness of human gut microbiome correlates with metabolic markers. Nature. 2013;500:541–546. doi: 10.1038/nature12506. - DOI - PubMed
    1. Nelson KE, Weinstock GM, Highlander SK, Worley KC, Creasy HH, Wortman JR, et al. A catalog of reference genomes from the human microbiome. Science. 2010;328:994–999. doi: 10.1126/science.1183605. - DOI - PMC - PubMed
    1. Hu GQ, Guo JT, Liu YC, Zhu HQ. MetaTISA: Metagenomic translation initiation site annotator for improving gene start prediction. Bioinformatics. 2009;25:1843–1845. doi: 10.1093/bioinformatics/btp272. - DOI - PubMed

Publication types

LinkOut - more resources