. 2016 Mar;23(3):417-29.
doi: 10.1038/cdd.2015.107. Epub 2015 Aug 7.

Heparan sulfation is essential for the prevention of cellular senescence

Affiliations

Heparan sulfation is essential for the prevention of cellular senescence

S H Jung et al. Cell Death Differ. 2016 Mar.

Abstract

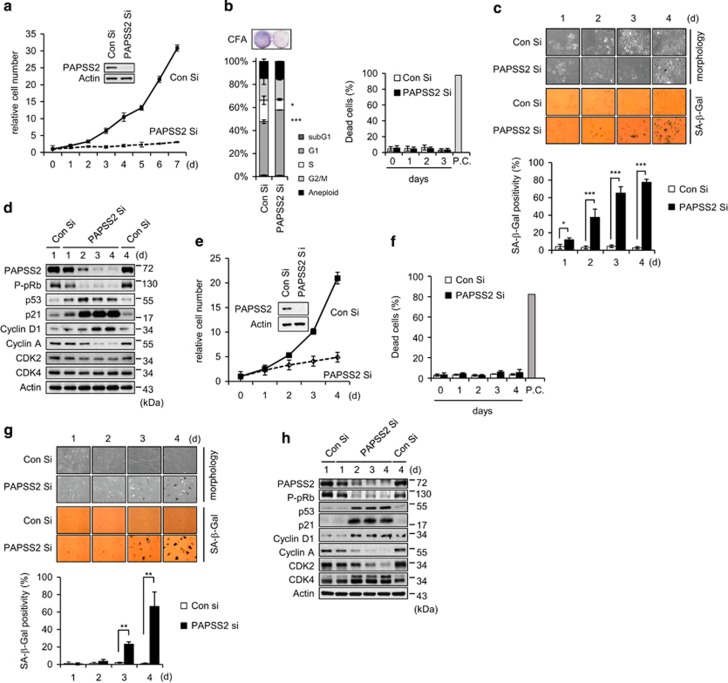
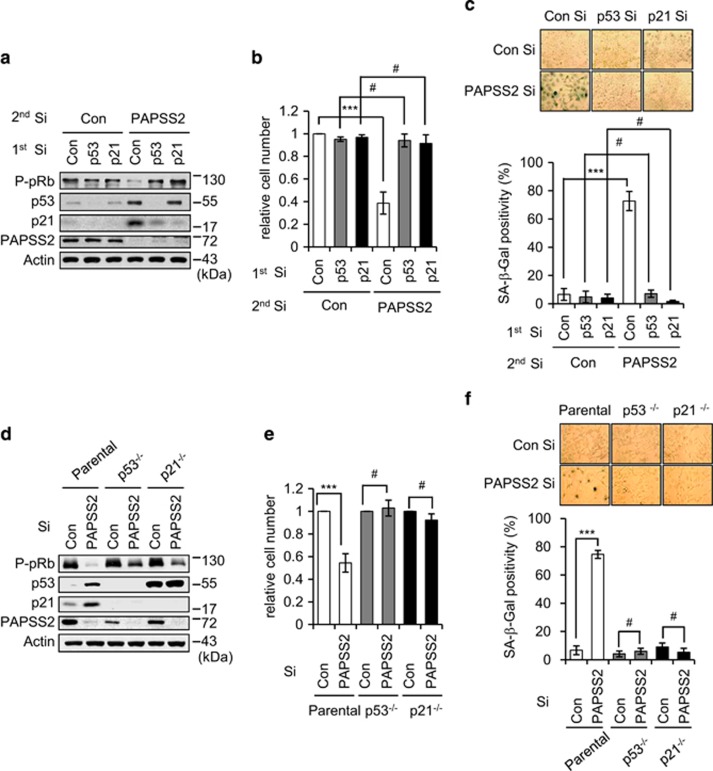
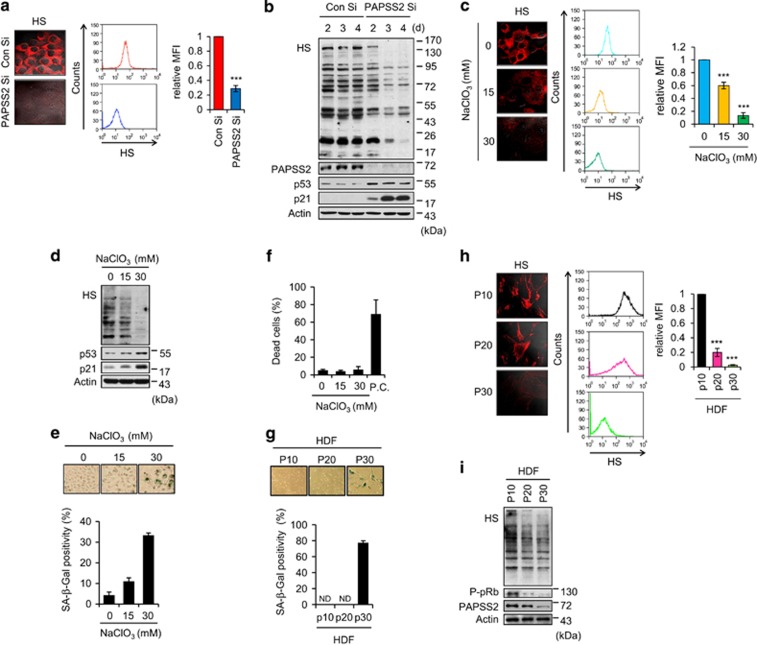
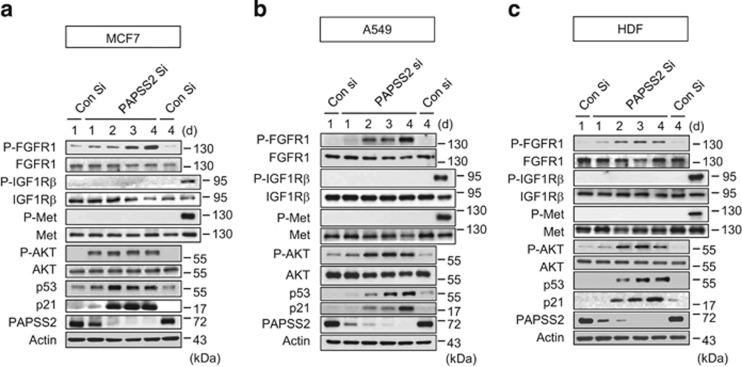
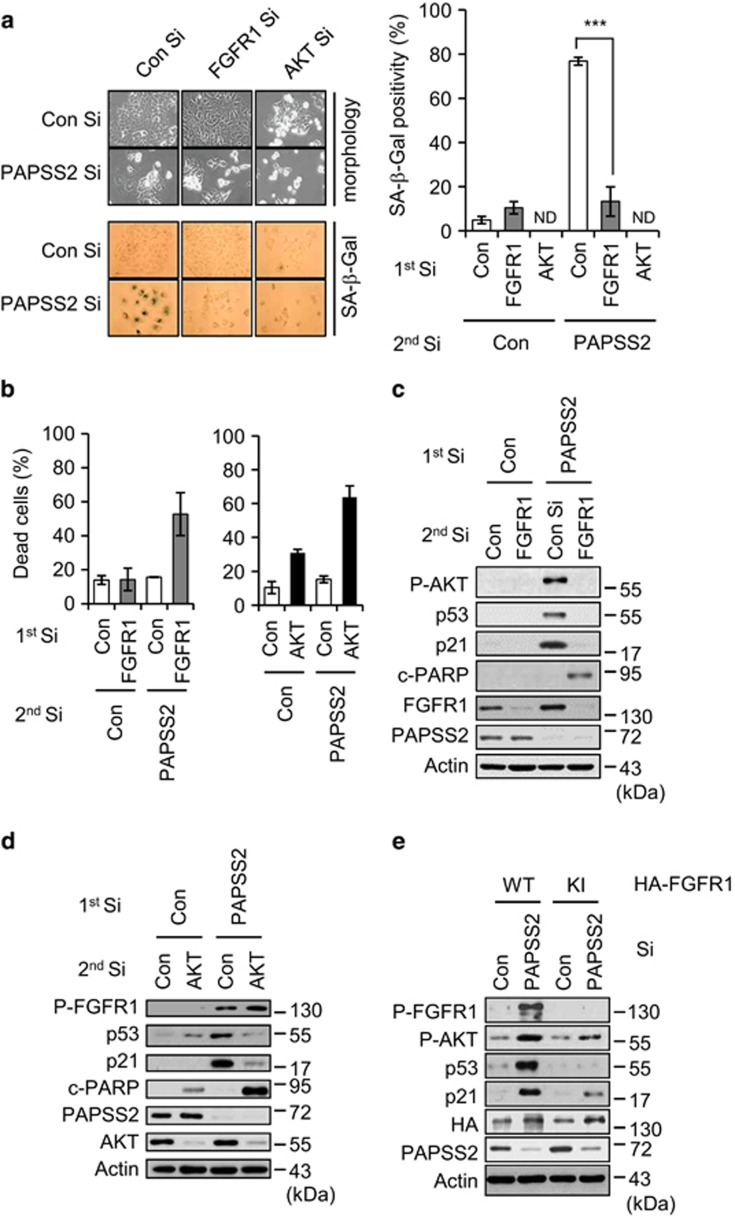
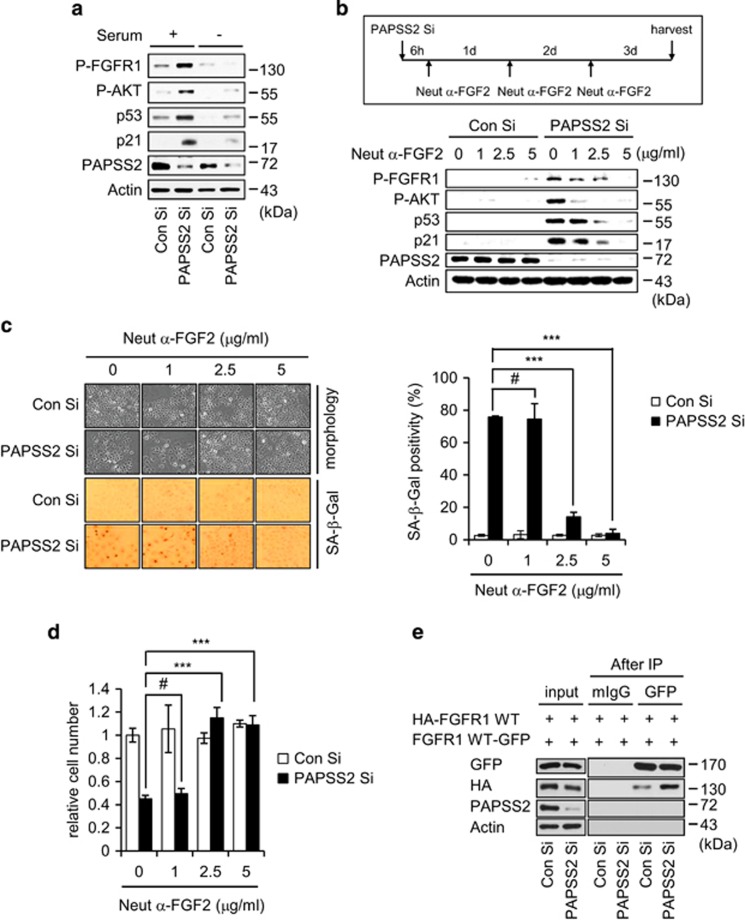
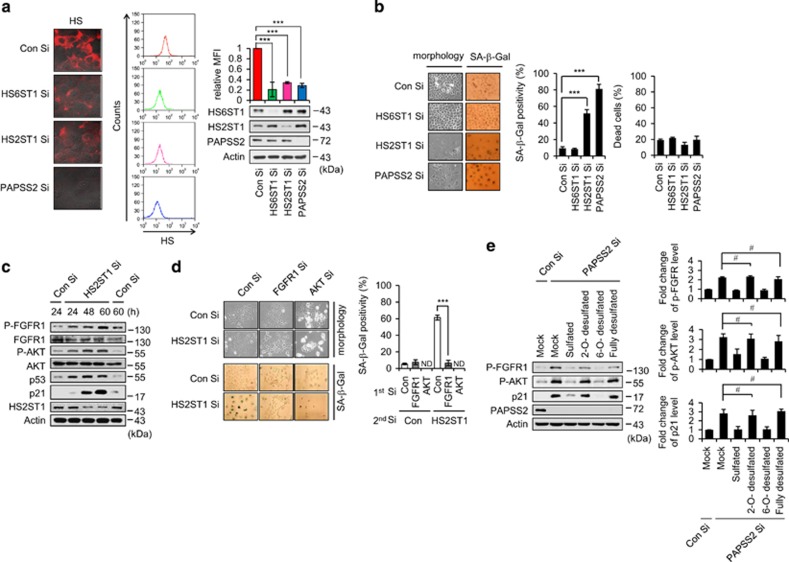
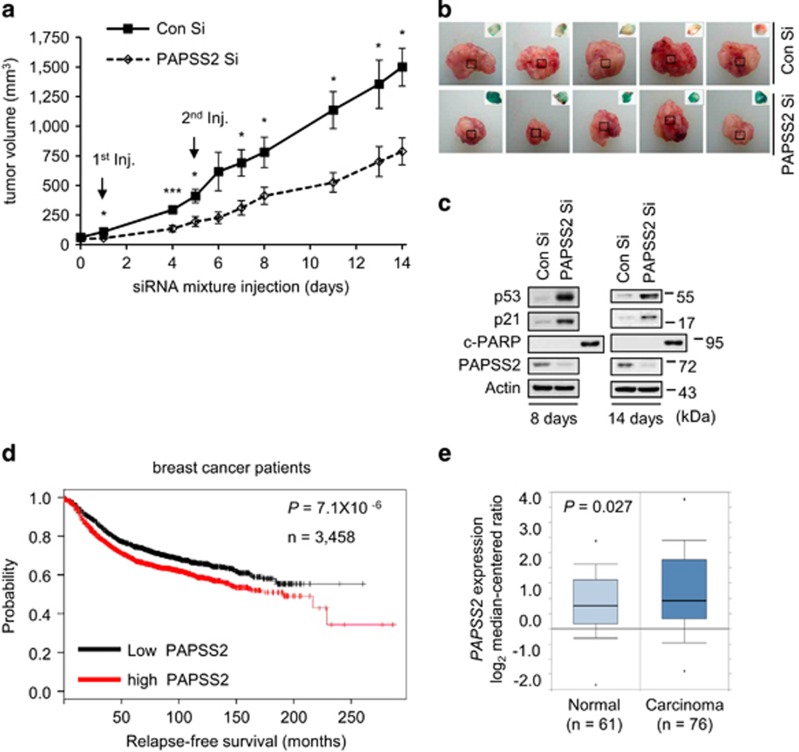
Cellular senescence is considered as an important tumor-suppressive mechanism. Here, we demonstrated that heparan sulfate (HS) prevents cellular senescence by fine-tuning of the fibroblast growth factor receptor (FGFR) signaling pathway. We found that depletion of 3'-phosphoadenosine 5'-phosphosulfate synthetase 2 (PAPSS2), a synthetic enzyme of the sulfur donor PAPS, led to premature cell senescence in various cancer cells and in a xenograft tumor mouse model. Sodium chlorate, a metabolic inhibitor of HS sulfation also induced a cellular senescence phenotype. p53 and p21 accumulation was essential for PAPSS2-mediated cellular senescence. Such senescence phenotypes were closely correlated with cell surface HS levels in both cancer cells and human diploid fibroblasts. The determination of the activation of receptors such as FGFR1, Met, and insulin growth factor 1 receptor β indicated that the augmented FGFR1/AKT signaling was specifically involved in premature senescence in a HS-dependent manner. Thus, blockade of either FGFR1 or AKT prohibited p53 and p21 accumulation and cell fate switched from cellular senescence to apoptosis. In particular, desulfation at the 2-O position in the HS chain contributed to the premature senescence via the augmented FGFR1 signaling. Taken together, we reveal, for the first time, that the proper status of HS is essential for the prevention of cellular senescence. These observations allowed us to hypothesize that the FGF/FGFR signaling system could initiate novel tumor defenses through regulating premature senescence.


Figures

Figure 1
Figure 1
PAPSS2 depletion suppresses cell growth due to premature senescence in MCF7 cells and HDFs. (ad) MCF7 cells were transfected with Con Si or PAPSS2 Si. (a) The numbers of viable cells are shown as relative values. Total protein was extracted from cells 3 days after siRNA transfection and was subjected to WB analysis. (b) Cell cycle distributions (left graph) and dead cell populations (right graph) were analyzed by FACS 3 days after siRNA transfection and at the indicated times after siRNA transfection, respectively. Doxorubicin-treated (10 μg/ml) MCF7 cells were used as a positive control (P.C.). A colony-forming assay (CFA) was also performed (left panel) 7 days after siRNA transfection. (c) Cellular morphology and SA-β-Gal positivity were assessed at the indicated times after siRNA transfection (upper panel), and the percentage of senescent cells was quantified (lower graph). (d) Cells were harvested at the indicated times after siRNA transfection and were subjected to WB analysis. (eh) HDFs were transfected with either Con Si or PAPSS2 Si. (e) Cell viability, (f) the percentage of dead cells, (g) morphological changes and SA-β-Gal positivity, and (h) WB analysis were performed as described in ad. Error bars indicate the S.D. of three independent experiments. ***P<0.001, **P<0.01, and *P<0.05
Figure 2
Figure 2
PAPSS2 depletion-mediated premature senescence occurs through the p53-p21 pathway. (a–c) MCF7 cells were transfected with Con Si, p53 Si, or p21 Si (first transfection) 6 h before transfection with Con Si or PAPSS2 Si (second transfection). (a) After 2 days, cells were harvested and subjected to WB analysis using the indicated antibodies. (b) Quantification of relative cell number and (c) SA-β-gal positivity were performed 3 days after transfection. (d–f) HCT116 parental, p53−/−, and p21−/− cells were transfected with Con Si or PAPSS2 Si, and experiments were performed as described in a–c. Cell numbers are relative to that of Con Si-transfected cells. Error bars indicate the S.D. of three independent experiments. ***P<0.001 and #P>0.05
Figure 3
Figure 3
Decrease in cellular sulfation is associated with premature and replicative senescence. (a–b) MCF7 cells were transfected with either Con Si or PAPSS2 Si. (a) Transfected cells were stained with an anti-HS (10E4) antibody and visualized (left panel) or subjected to FACS to quantify the HS level (middle graph). Quantified data are shown as the mean fluorescence intensity (MFI) relative to Con Si-transfected cells (right graph). (b) Cells were harvested at the indicated times after siRNA transfection and subjected to WB analysis. (cf) Undersulfation resulting from NaClO3 treatment induces premature senescence. (c) MCF7 cells were cultured in the absence or presence of NaClO3 for 3 d. The HS level were measured as described in a. (d) Analyses of WB, (e) morphological changes and SA-β-Gal positivity, and (f) the percentage of dead cells were performed. (g–i) Cellular sulfation level is associated with replicative senescence in an HDF system. (g) SA-β-Gal positivity in HDFs at passage 10 (p10), p20, and p30. ND, not determined. (h) The HS level was measured as described in a. (i) HDFs were harvested at the indicated passages and subjected to WB analysis. Error bars indicate the S.D. of three independent experiments. ***P<0.001
Figure 4
Figure 4
PAPSS2 depletion induces augmented and sustained FGFR/AKT activation. (a) MCF7 cells, (b) A549 cells, and (c) HDF cells were harvested at the indicated times after siRNA transfection and subjected to WB analysis
Figure 5
Figure 5
Augmented FGFR1-AKT-p53-p21 signaling is critical for PAPSS2-mediated premature senescence. (a–c) MCF7 cells were transfected with FGFR1 Si or AKT Si (first transfection) 6 h before transfection with Con Si or PAPSS2 Si (second transfection). (a) Analyses of morphological changes (left panel) and SA-β-Gal positivity (right graph), (b) the percentage of dead cells, and (cd) WB analysis were performed. (e) Cells were transfected with HA-tagged WT or KI FGFR1 6 h before transfection with either Con Si or PAPSS2 Si. After 2 days, the transfected cells were harvested and subjected to WB analysis. Error bars indicate the S.D. of three independent experiments. ***P<0.001. ND, not determined
Figure 6
Figure 6
FGF2 has an essential role in augmented FGFR1-AKT-p53-p21 signaling in PAPSS2-depleted cells. (a) MCF7 cells transfected with Con Si or PAPSS2 Si for 6 h were cultured in the absence or presence of serum for an additional 36 h; cells were then harvested and subjected to WB analysis. (b) MCF7 cells were transfected with Con Si or PAPSS2 Si 6 h before incubation with or without increasing concentrations of Neut α-FGF2 for 3 days (upper timeline). Analyses of (b) WB (lower panel), (c) morphological changes (left panel) and SA-β-Gal positivity (right graph), and (d) relative cell number were performed. Error bars indicate the S.D. of three independent experiments. Statistical significance was determined using one-factor analysis of variance and Holm–Sidak post hoc tests. ***P<0.001 and #P>0.05. (e) Co-IP assay of epitope-tagged FGFR1. Cells were co-transfected with HA- and GFP-tagged WT FGFR1 24 h before transfection with Con Si or PAPSS2 Si. Transfected cells were immunoprecipitated using an anti-GFP antibody and then blotted with an anti-HA antibody
Figure 7
Figure 7
HS2ST1 depletion induces activation of FGFR1 signaling, resulting in premature senescence. (a) After transfection of either HS6ST1 Si or HS2ST1 Si, MCF7 cell surface HS levels were visualized (left panel) and quantified (right upper graph), and WB analysis was performed (right lower pannel). (b) Morphological changes (left panel) and SA-β-Gal positivity (middle graph) and percentage of dead cells (right graph) were determined. PAPSS2-depleted MCF7 cells were used as a control. (c) MCF7 cells were harvested at the indicated times after siRNA transfection and subjected to WB analysis. (d) Morphological changes (left panel) and SA-β-Gal positivity (right graph) were determined. (e) MCF7 cells were transfected with Con Si or PAPSS2 Si 6 h before incubation with or without heparan-derived octasaccharides for 3 days. Cells were then lysed and subjected to WB analysis (left panel). Graphs show quantification of WB (right panel). Error bars indicate the S.D. of three independent experiments. ***P<0.001. # indicates statistical indifference, P>0.05. ND, not determined.
Figure 8
Figure 8
PAPSS2 depletion retards tumor growth due to the induction of cellular senescence in a xenograft tumor mouse model. (a) Tumor volume in xenograft mice (n=5) was measured at the indicated times. Error bars indicate S.E.M. ***P<0.001 and *P<0.05. (b) Pictures of excised and SA-β-Gal-stained tumors 14 days after the first siRNA injection. (c) Tumor tissue lysates 8 or 14 days after the first siRNA injection were subjected to WB analysis. (d) Kaplan–Meier curves of relapse-free survival times of patients with breast cancer. Data were obtained from http://kmplot.com/analysis/. Statistical significance was determined using the log-rank test. (e) Box plots comparing PAPSS2 expression (as log2 median-centered ratios) in normal breast tissue and carcinoma breast tissue. Dots indicate extreme data values. Data were obtained from http://oncomine.org/.

Similar articles

Cited by

References

    1. Narita M, Lowe SW. Senescence comes of age. Nat Med 2005; 11: 920–922. - PubMed
    1. Campisi J. Aging, cellular senescence, and cancer. Annu Rev Physiol 2013; 75: 685–705. - PMC - PubMed
    1. Collado M, Serrano M. Senescence in tumours: evidence from mice and humans. Nat Rev Cancer 2010; 10: 51–57. - PMC - PubMed
    1. Campisi J, d'Adda di Fagagna F. Cellular senescence: when bad things happen to good cells. Nat Rev Mol Cell Biol 2007; 8: 729–740. - PubMed
    1. Prieur A, Peeper DS. Cellular senescence in vivo: a barrier to tumorigenesis. Curr Opin Cell Biol 2008; 20: 150–155. - PubMed

Publication types

MeSH terms