. 2015 Aug 6:8:14.
doi: 10.1186/s13069-015-0031-z. eCollection 2015.

In vitro reversion of activated primary human hepatic stellate cells

Affiliations

In vitro reversion of activated primary human hepatic stellate cells

Adil El Taghdouini et al. Fibrogenesis Tissue Repair. .

Abstract

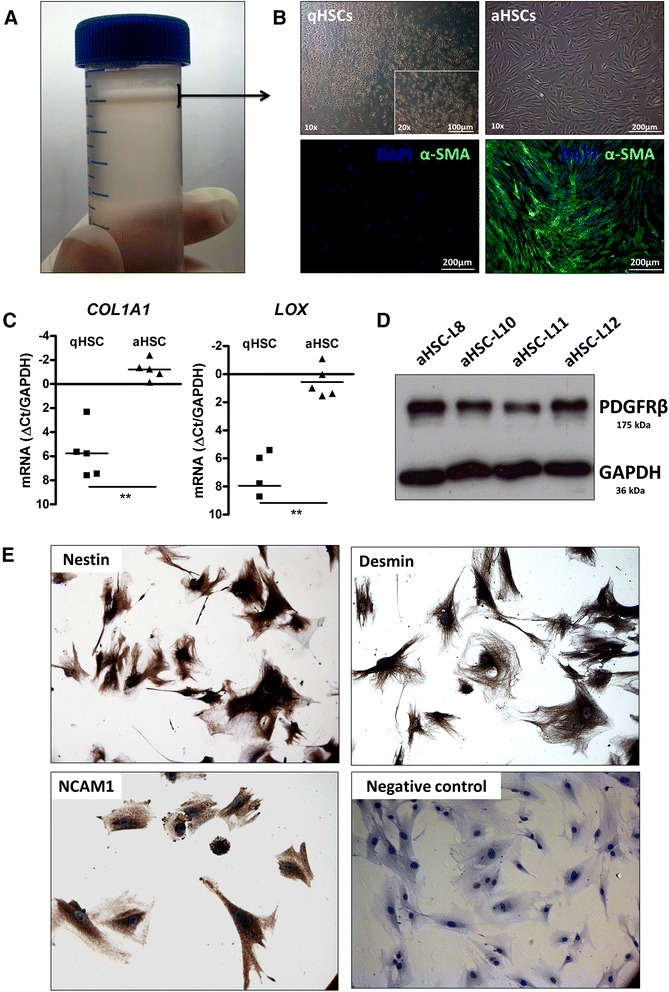
Background: Liver fibrosis is characterized by the excessive formation and accumulation of matrix proteins as a result of wound healing in the liver. A main event during fibrogenesis is the activation of the liver resident quiescent hepatic stellate cell (qHSC). Recent studies suggest that reversion of the activated HSC (aHSC) phenotype into a quiescent-like phenotype could be a major cellular mechanism underlying fibrosis regression in the liver, thereby offering new therapeutic perspectives for the treatment of liver fibrosis. Whether human HSCs have the ability to undergo a similar reversion in phenotype is currently unknown. The aim of the present study is to identify experimental conditions that can revert the in vitro activated phenotype of primary human HSCs and consequently to map the molecular events associated with this reversion process by gene expression profiling.

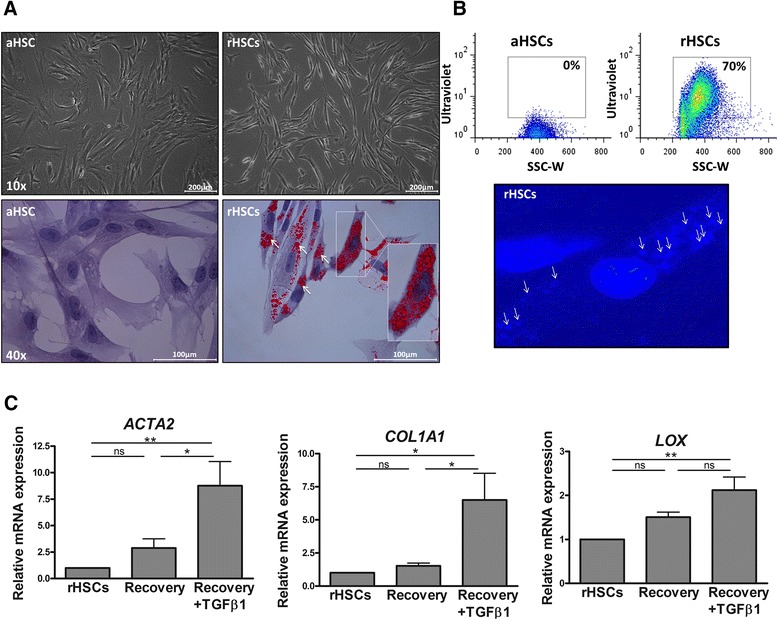
Results: We find that epidermal growth factor (EGF) and fibroblast growth factor 2 (FGF2) synergistically downregulate the expression of ACTA2 and LOX in primary human aHSCs. Their combination with oleic acid, palmitic acid, and retinol further potentiates a more quiescent-like phenotype as demonstrated by the abundant presence of retinyl ester-positive intra-cytoplasmic lipid droplets, low expression levels of activation markers, and a reduced basal as well as cytokine-stimulated proliferation and matrix metalloproteinase activity. Gene expression profiling experiments reveal that these in vitro reverted primary human HSCs (rHSCs) display an intermediary phenotype that is distinct from qHSCs and aHSCs. Interestingly, this intermediary phenotype is characterized by the increased expression of several previously identified signature genes of in vivo inactivated mouse HSCs such as CXCL1, CXCL2, and CTSS, suggesting also a potential role for these genes in promoting a quiescent-like phenotype in human HSCs.

Conclusions: We provide evidence for the ability of human primary aHSCs to revert in vitro to a transitional state through synergistic action of EGF, FGF2, dietary fatty acids and retinol, and provide a first phenotypic and genomic characterization of human in vitro rHSCs.

Keywords: Fibrosis; Gene expression profiling; Hepatic stellate cells; Inactivation; Quiescent; Reversion.


Figures

Fig. 1
Fig. 1
Isolation and culture activation of human primary HSCs. a Quiescent HSC-enriched cell layer (arrow) following an 8 % Nycodenz density gradient centrifugation. b Light microscopic and α-SMA immunocytochemistry images of the freshly isolated, qHSC-enriched cell population and fully culture activated HSCs (passage 4). c Log2 mRNA expression levels of COL1A1 and LOX in freshly isolated, non-plated qHSCs and aHSCs from five different donors. In the graphs, **p < 0.01. d PDGFRβ and GAPDH protein levels in aHSCs from four donors. e Positive immunostainings for the neural markers NCAM1, nestin, and desmin
Fig. 2
Fig. 2
EGF, FGF2, retinol, palmitic acid, and oleic acid act synergistically to negatively regulate the expression of ACTA2, COL1A1, and LOX in human primary HSCs. a Human aHSCs were exposed to recombinant human EGF (20 ng/mL), FGF2 (10 ng/mL), a combination of both, or a combination of oleic acid (100 μM) (OA), palmitic acid (100 μM) (PA), and retinol (5 μM) for 5 days. Extracted RNA was processed and analyzed for ACTA2, COL1A1, and LOX expression by RTq-PCR. Results are presented as relative fold change to untreated control cells (dotted line). b mRNA expression levels of ACTA2, COL1A1, and LOX in non-cultured quiescent (q), culture activated (a), and reverted (r) HSCs incubated for 5 days with RM (20 ng/mL EGF, 10 ng/mL FGF2, 100 μM OA, 100 μM PA, 5 μM R) from three different (corresponding) donors. The expression levels are presented as relative fold change to aHSCs. The results presented are from three to five different donors. In the graphs, the results are displayed as means ± SEM. ns not significant, p ≥ 0.05, *p < 0.05, **p < 0.01, ***p < 0.001. c α-SMA, COL1A1, and GAPDH protein levels in aHSCs and rHSCs from corresponding donors
Fig. 3
Fig. 3
EGF, FGF2, retinol, palmitic acid, and oleic acid restore a reversible, quiescent-like phenotype in culture activated human primary HSCs. a Light microscopic and Oil Red O staining images of aHSCs and rHSCs. b FACS detection and microscopic image of the intrinsic fluorescence (at a wavelength of ~328 nm) of all-trans retinyl esters in UV-excited aHSCs and rHSCs. The arrows highlight the intrinsic fluorescent signal of retinyl esters inside the cytoplasmic lipid droplets. c The reversibility of the RM-induced downregulation of ACTA2, COL1A1, and LOX was assessed by washing the cells after a 5-day incubation period, followed by an additional 2-day culture in the presence or absence of recombinant human TGFβ (10 ng/mL), in FBS-free medium. The expression levels are presented as relative fold change to rHSCs. The results presented are from three to five different donors. In the graphs, the results are displayed as means ± SEM. ns not significant, p ≥ 0.05, *p < 0.05, **p < 0.01
Fig. 4
Fig. 4
Functional comparison of human aHSCs and rHSCs. a EdU staining images showing the influence of RM on basal and PDGF-BB-induced HSC proliferation. b The percentage proliferative cells, calculated as the ratio of EdU-positive nuclei over the total (DAPI) nuclei. c The PDGF-BB (20 ng/mL) induced fold change in proliferation for aHSCs and rHSCs, relative to their basal condition. d Fluorescent images depicting the basal and TGFβ-induced (10 ng/mL) proteolytic digestion (green) of the fluorescein-labeled gelatin substrate by aHSCs and rHSCs. e The quantified basal and TGFβ-induced matrix metalloproteinase activity of aHSCs and rHSCs presented as the percentage green stained area over the total image area. f The PDGF-BB-inducible migration of aHSCs and rHSCs was assessed in a transwell migration assay. The aHSCs and rHSCs were seeded in collagen-coated Boyden chambers and stimulated with PDGF-BB (20 ng/mL) or with its solvent as a control, in the lower compartment. Results are presented as the number of migrated cells in each condition. The presented results are from three different donors. ns not significant, p ≥ 0.05, *p < 0.05
Fig. 5
Fig. 5
Gene expression changes elicited during the in vitro reversion of human HSC activation. a Heatmap representing the hierarchical clustering of genes significantly differentially regulated between aHSCs, qHSCs, and rHSCs. b Venn diagram showing the number of genes significantly differentially regulated between qHSCs and rHSCs or aHSCs and rHSCs. The intersection of the Venn diagram shows the number of overlapping genes significantly differentially regulated in both comparisons. c List of fold changes (relative to aHSCs) for the top 10 genes upregulated and downregulated in rHSCs (microarray data). d Confirmation of the expression levels of selected top deregulated genes by RTq-PCR. The presented results are from three different donors. **p < 0.01, ***p < 0.001
Fig. 6
Fig. 6
Gene expression changes during in vitro reversion of human primary HSCs inversely correlate with changes observed during in vitro HSC activation. a Venn diagram showing the number of genes differentially regulated during HSC activation ([qHSCs vs aHSCs], p ≤ 0.05 and fold change ≥2) and the number of genes differentially regulated during in vitro reversion to quiescence-like ([aHSCs vs rHSCs], p ≤ 0.05 and fold change ≥2). The intersection of the Venn diagram shows the number of overlapping genes between both comparisons. b Expression heatmap for the genes that are significantly upregulated during HSC activation and significantly downregulated during reversion to quiescence-like. c Profile plot showing the expression profile of ACTG2 expression in qHSCs, aHSCs, and rHSCs as illustration for the 148 genes showing a similar expression profile. d The top five Gene Ontology (GO) terms and KEGG pathways associated with the set of genes represented in (c). e Expression heatmap for the genes that are significantly downregulated during HSC activation and significantly upregulated during reversion to quiescent-like cells. f Profile plot showing the expression profile of NFKBIA expression in qHSCs, aHSCs, and rHSCs as illustration for the 64 genes showing a similar expression profile. g The top five GO terms and KEGG pathways associated with the set of genes represented in (f)

References

    1. Bataller R, Brenner DA. Liver fibrosis. J Clin Invest. 2005;115(2):209–18. doi: 10.1172/JCI24282. - DOI - PMC - PubMed
    1. Wynn TA, Ramalingam TR. Mechanisms of fibrosis: therapeutic translation for fibrotic disease. Nat Med. 2012;18(7):1028–40. doi: 10.1038/nm.2807. - DOI - PMC - PubMed
    1. Mederacke I, Hsu CC, Troeger JS, Huebener P, Mu X, Dapito DH, et al. Fate tracing reveals hepatic stellate cells as dominant contributors to liver fibrosis independent of its aetiology. Nat Commun. 2013;4:2823. doi: 10.1038/ncomms3823. - DOI - PMC - PubMed
    1. Friedman SL. Hepatic stellate cells: protean, multifunctional, and enigmatic cells of the liver. Physiol Rev. 2008;88(1):125–72. doi: 10.1152/physrev.00013.2007. - DOI - PMC - PubMed
    1. Reynaert H, Urbain D, Geerts A. Regulation of sinusoidal perfusion in portal hypertension. Anat Rec. 2008;291(6):693–8. doi: 10.1002/ar.20669. - DOI - PubMed