. 2016 Mar;10(3):596-608.
doi: 10.1038/ismej.2015.137. Epub 2015 Aug 7.

Global diversity and biogeography of deep-sea pelagic prokaryotes

Affiliations

Global diversity and biogeography of deep-sea pelagic prokaryotes

Guillem Salazar et al. ISME J. 2016 Mar.

Abstract

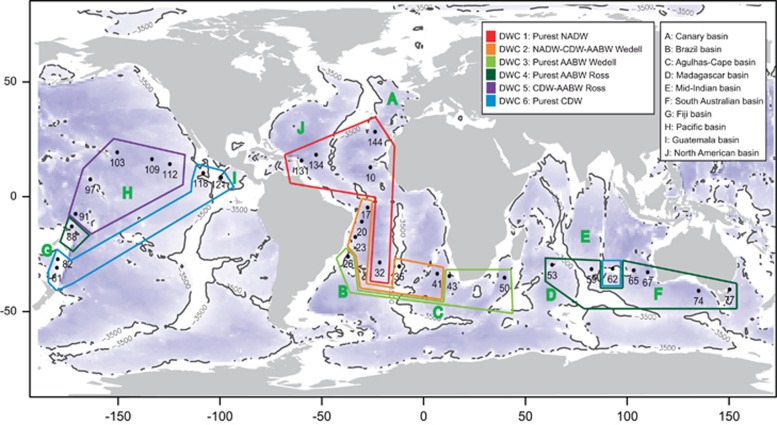
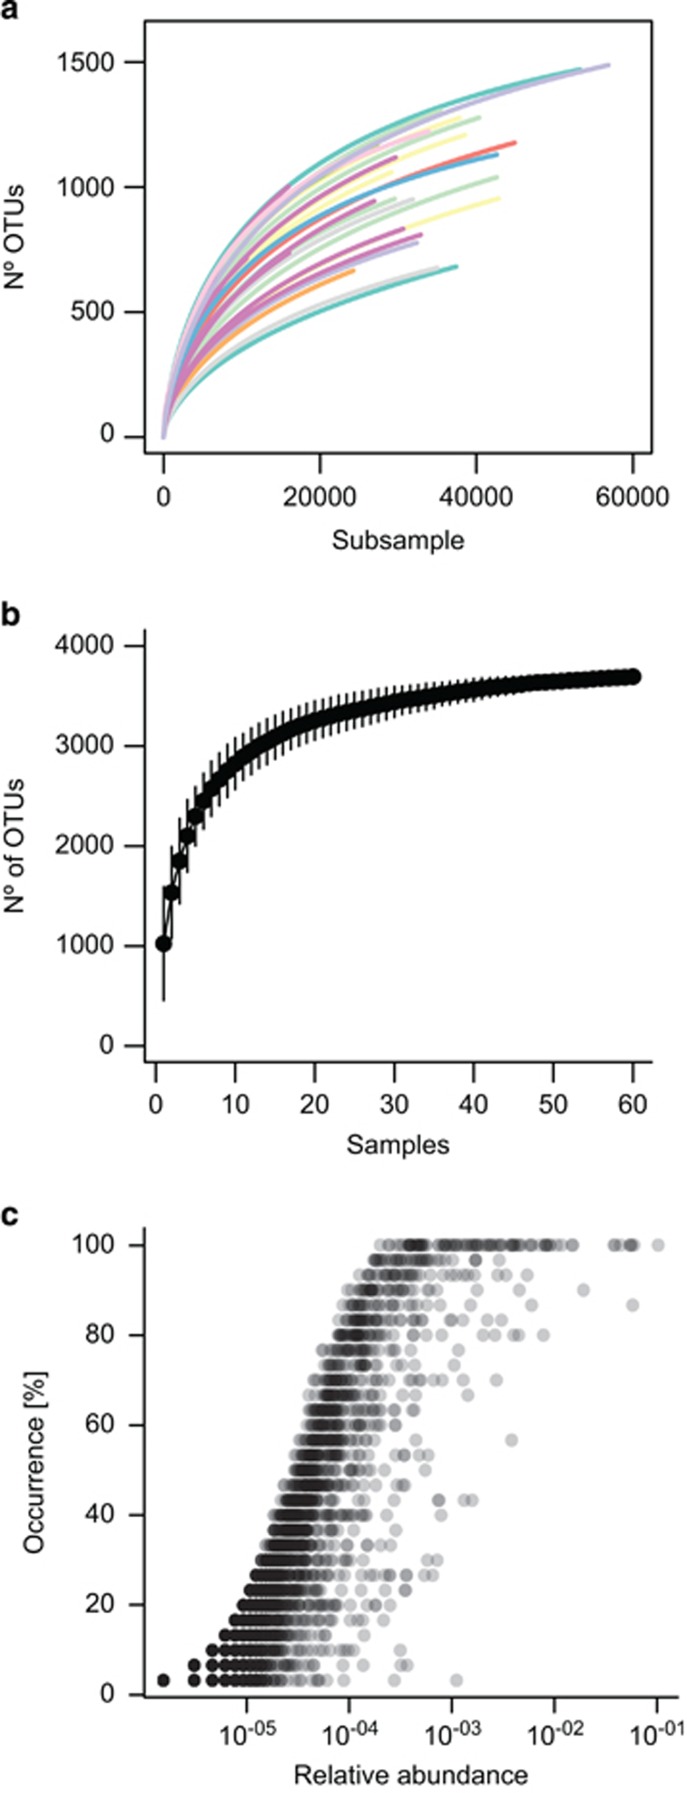
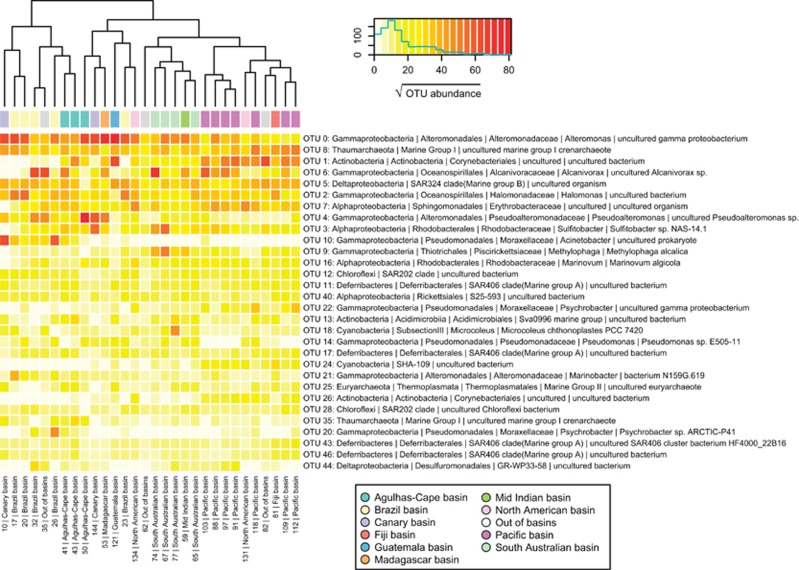
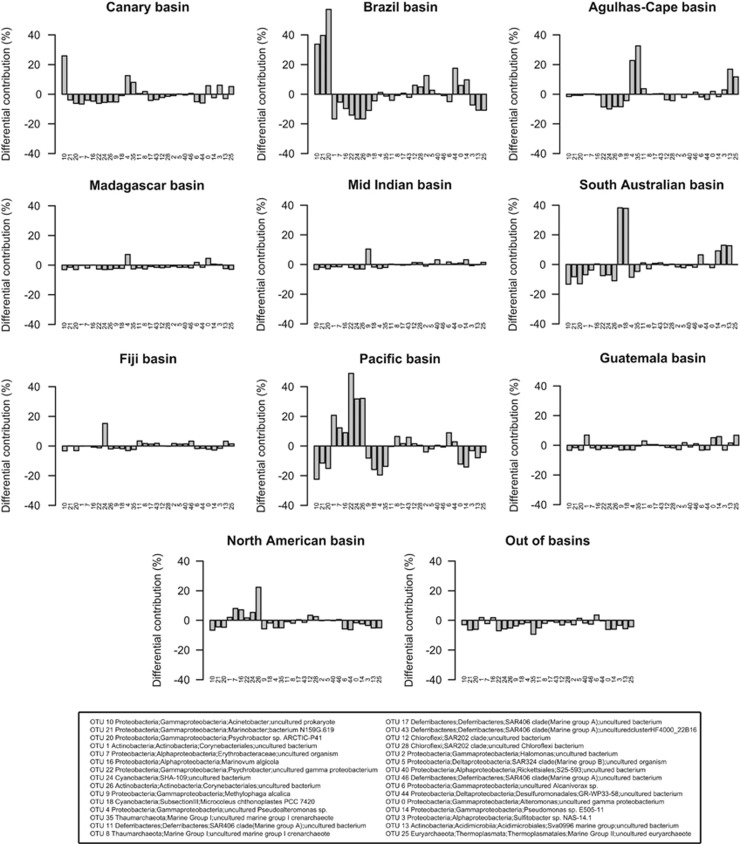
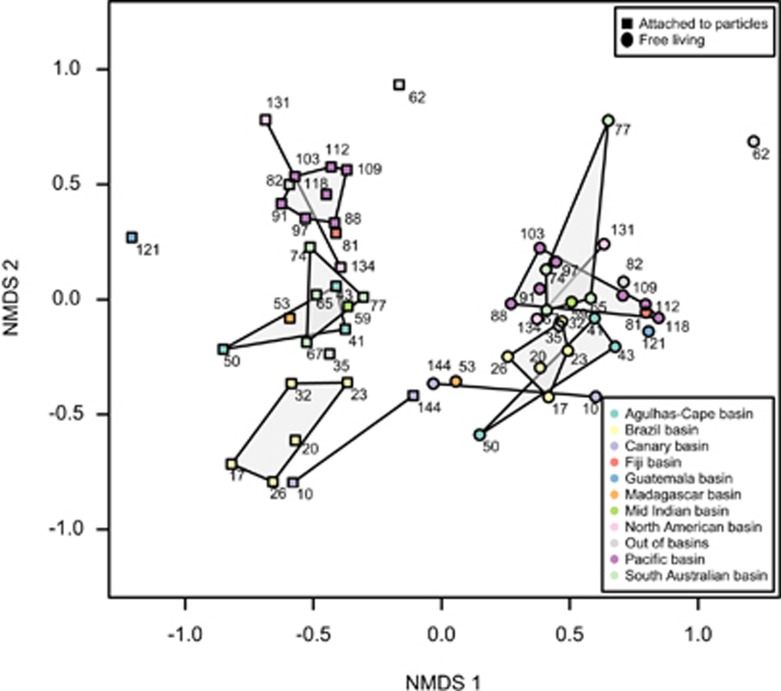
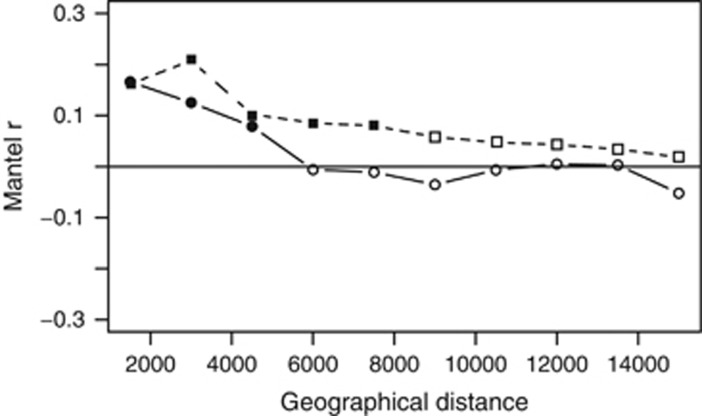
The deep-sea is the largest biome of the biosphere, and contains more than half of the whole ocean's microbes. Uncovering their general patterns of diversity and community structure at a global scale remains a great challenge, as only fragmentary information of deep-sea microbial diversity exists based on regional-scale studies. Here we report the first globally comprehensive survey of the prokaryotic communities inhabiting the bathypelagic ocean using high-throughput sequencing of the 16S rRNA gene. This work identifies the dominant prokaryotes in the pelagic deep ocean and reveals that 50% of the operational taxonomic units (OTUs) belong to previously unknown prokaryotic taxa, most of which are rare and appear in just a few samples. We show that whereas the local richness of communities is comparable to that observed in previous regional studies, the global pool of prokaryotic taxa detected is modest (~3600 OTUs), as a high proportion of OTUs are shared among samples. The water masses appear to act as clear drivers of the geographical distribution of both particle-attached and free-living prokaryotes. In addition, we show that the deep-oceanic basins in which the bathypelagic realm is divided contain different particle-attached (but not free-living) microbial communities. The combination of the aging of the water masses and a lack of complete dispersal are identified as the main drivers for this biogeographical pattern. All together, we identify the potential of the deep ocean as a reservoir of still unknown biological diversity with a higher degree of spatial complexity than hitherto considered.


Figures

Figure 1
Figure 1
World map showing the location of the Malaspina sampling stations in the present study. The deep-water cluster derived from dominant water masses found at each station are color-coded, and the deep-oceanic basins defined according to bathymetry below 3500 m depth (see Materials and methods for details) are indicated with letters.
Figure 2
Figure 2
Rarefaction curves. (a) within samples, individual-based and (b) sample-based. Global data set relative abundance vs occurrence (that is, the percentage of samples in which an OTU occurs) for all the OTUs (c). The sample-based rarefaction curve has been calculated for the entire data set. The deep-oceanic basins to which each station belongs are indicated with different colors in (a). (legend in Figure 5). No significant differences were detected for richness/diversity (neither OTU number, Chao1 nor Shannon index) between basins.
Figure 3
Figure 3
Heatmap representing the square root of abundances (number of reads) of the 30 most abundant OTUs (rows) along the 30 stations (columns). Subsampled abundances to the minimum sequencing depth (10 617 reads per sample) have been used for comparison and data from the two size fractions within a station was summed after subsampling. The deep-oceanic basins to which each station belongs are indicated at the top (see color legend). Taxonomical annotation for each OTU is based on the SILVA taxonomic assignment of each OTU representative sequence. OTUs are ordered top to bottom based on their global abundance in the whole data set.
Figure 4
Figure 4
Differential contribution (Di,b; in %) of each basin to the total abundance of each of the 30 most abundant OTUs (see Supplementary Information for calculation details). Numbers below each bar represent each OTU, whose taxonomical affiliation is described in the legend, based on SILVA taxonomy. OTUs are the same as in Figure 3 but ordered using a clustering based on Di,b values (details not shown) for a clearer visualization.
Figure 5
Figure 5
Non-metric multidimensional scaling (NMDS) analysis of beta-diversity (Bray–Curtis distances) for the 60 samples in the data set based on iTags. Size-fraction is coded with point style (squares, attached and circles, free-living) and deep-oceanic basins following color codes (see legends). Numbers close to each sample represent the station number (see Figure 1).
Figure 6
Figure 6
Mantel correlogram for particle-attached (squares) and free-living (circles) prokaryotic communities testing the autocorrelation on community composition by performing sequential Mantel tests between the Bray–Curtis dissimilarities and the grouping of samples using geographical distance classes set at 1500 m. Filled points represent significant correlations after Bonferroni correction. Mantel correlograms were run up to a maximal distance of 15 000 km.

References

    1. Acinas SG, Klepac-Ceraj V, Hunt DE, Pharino C, Ceraj I, Distel DL et al. (2004). Fine-scale phylogenetic architecture of a complex bacterial community. Nature 430: 551–554. - PubMed
    1. Agogué H, Lamy D, Neal PR, Sogin ML, Herndl GJ. (2011). Water mass-specificity of bacterial communities in the North Atlantic revealed by massively parallel sequencing. Mol Ecol 20: 258–274. - PMC - PubMed
    1. Allen LZ, Allen EE, Badger JH, McCrow JP, Paulsen IT, Elbourne LD et al. (2012). Influence of nutrients and currents on the genomic composition of microbes across an upwelling mosaic. ISME J 6: 1403–1414. - PMC - PubMed
    1. Altschul SF, Gish W, Miller W, Myers EW, Lipman DJ. (1990). Basic local alignment search tool. J Mol Biol 215: 403–410. - PubMed
    1. Anderson MJ. (2001). A new method for non-parametric multivariate analysis of variance. Austral Ecol 26: 32–46.

Publication types

Substances