

Voxel Based Morphometry Alterations in Mal de Debarquement Syndrome
- PMID: 26252893
- PMCID: PMC4529307
- DOI: 10.1371/journal.pone.0135021
Voxel Based Morphometry Alterations in Mal de Debarquement Syndrome
Abstract
Background: Mal de debarquement syndrome (MdDS) is a disorder of chronic self-motion perception that occurs though entrainment to rhythmic background motion, such as from sea voyage, and involves the perception of low-frequency rocking that can last for months or years. The neural basis of this persistent sensory perception abnormality is not well understood.
Methods: We investigated grey matter volume differences underlying persistent MdDS by performing voxel-based morphometry on whole brain and pre-specified ROIs in 28 individuals with MdDS and comparing them to 18 age, sex, and handedness matched controls.
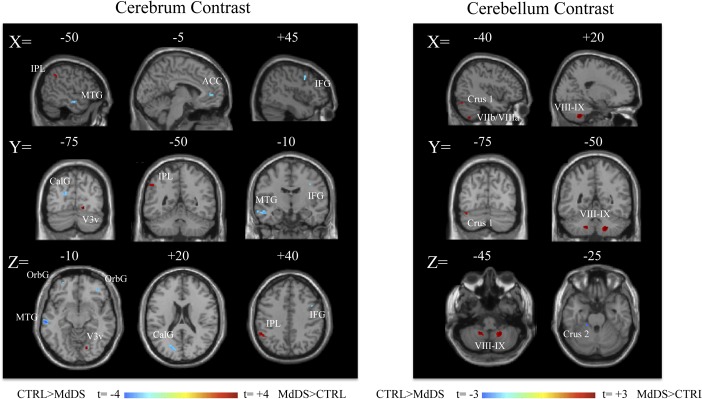
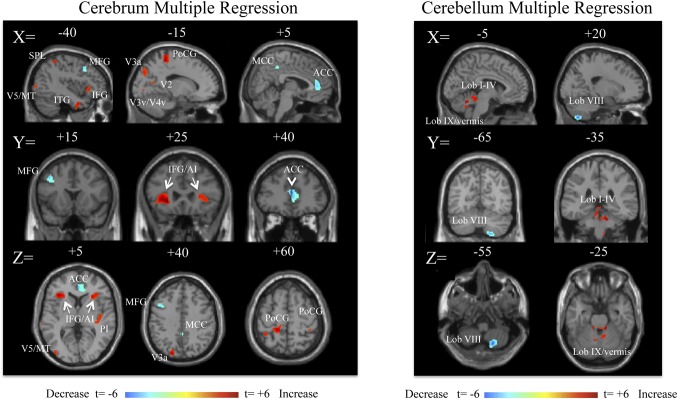
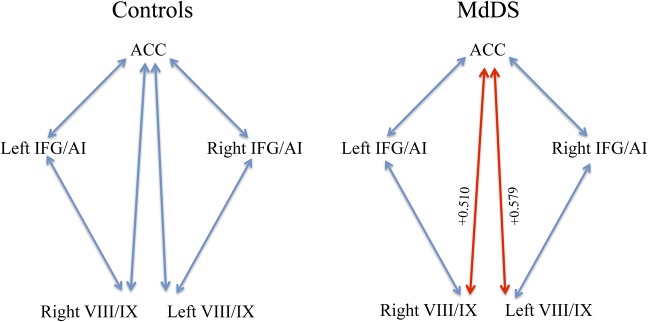
Results: MdDS participants exhibited greater grey matter volume in the left inferior parietal lobule, right inferior occipital gyrus (area V3v), right temporal pole, bilateral cerebellar hemispheric lobules VIII/IX and left lobule VIIa/VIIb. Grey matter volumes were lower in bilateral inferior frontal, orbitofrontal, pregenual anterior cingulate cortex (pgACC) and left superior medial gyri (t = 3.0, p<0.005uncorr). In ROI analyses, there were no volume differences in the middle occipital gyrus (region of V5/MT) or parietal operculum 2 (region of the parietoinsular vestibular cortex). Illness duration was positively related to grey matter volume in bilateral inferior frontal gyrus/anterior insula (IFG/AI), right posterior insula, superior parietal lobule, left middle occipital gyrus (V5/MT), bilateral postcentral gyrus, anterior cerebellum, and left cerebellar hemisphere and vermian lobule IX. In contrast, illness duration was negatively related to volume in pgACC, posterior middle cingulate gyrus (MCC), left middle frontal gyrus (dorsolateral prefrontal cortex-DLPFC), and right cerebellar hemispheric lobule VIIIb (t = 3.0, p<0.005uncorr). The most significant differences were decreased volume in the pgACC and increased volume in the left IFG/AI with longer illness duration (qFDRcorr <0.05). Concurrent medication use did not correlate with these findings or have a relationship with duration of illness. MdDS participants showed positive correlations between grey matter volume in pgACC and bilateral cerebellar lobules VIII/IX, which was not seen in controls.
Conclusions: Individuals with MdDS show brain volume differences from healthy controls as well as duration of illness dependent volume changes in (a) visual-vestibular processing areas (IPL, SPL, V3, V5/MT), (b) default mode network structures (cerebellar IX, IPL, ACC), (c) salience network structures (ACC and IFG/AI) (d) somatosensory network structures (postcentral gyrus, MCC, anterior cerebellum, cerebellar lobule VIII), and (e) a structure within the central executive network (DLPFC). The identification of these associations may enhance future investigations into how exposure to oscillating environments can modulate brain function and affect motion perception as well cognitive and affective control.
Conflict of interest statement
Figures
References
-
- Grünbauer WM, Dieterich M, Brandt T. Bilateral vestibular failure impairs visual motion perception even with the head still. Neuroreport 1998, June 1;9(8):1807–10. - PubMed
-
- Hüfner K, Hamilton DA, Kalla R, Stephan T, Glasauer S, Ma J, et al. Spatial memory and hippocampal volume in humans with unilateral vestibular deafferentation. Hippocampus 2007;17(6):471–85. - PubMed
-
- Staab JP, Ruckenstein MJ. Expanding the differential diagnosis of chronic dizziness. Arch Otolaryngol Head Neck Surg 2007, February;133(2):170–6. - PubMed
-
- Brandt T. Phobic postural vertigo. Neurology 1996;46(6):1515–9. - PubMed
Publication types
MeSH terms
Substances
Supplementary concepts
Grants and funding
LinkOut - more resources
Full Text Sources
Other Literature Sources
Medical
Research Materials
