

Reciprocal relationship of T regulatory cells and monocytic myeloid-derived suppressor cells in LP-BM5 murine retrovirus-induced immunodeficiency
- PMID: 26253145
- PMCID: PMC5394747
- DOI: 10.1099/jgv.0.000260
Reciprocal relationship of T regulatory cells and monocytic myeloid-derived suppressor cells in LP-BM5 murine retrovirus-induced immunodeficiency
Abstract
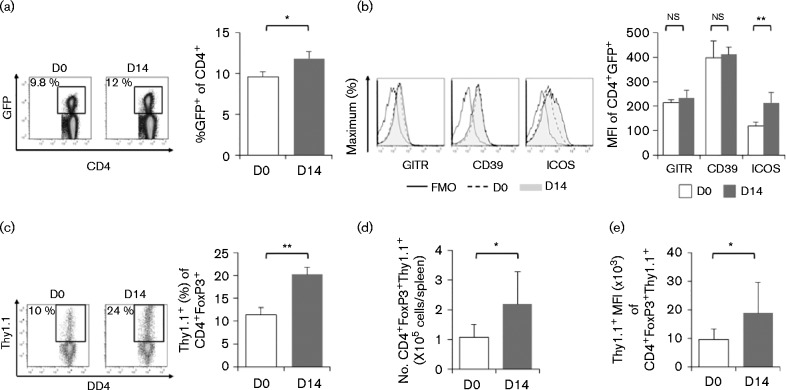
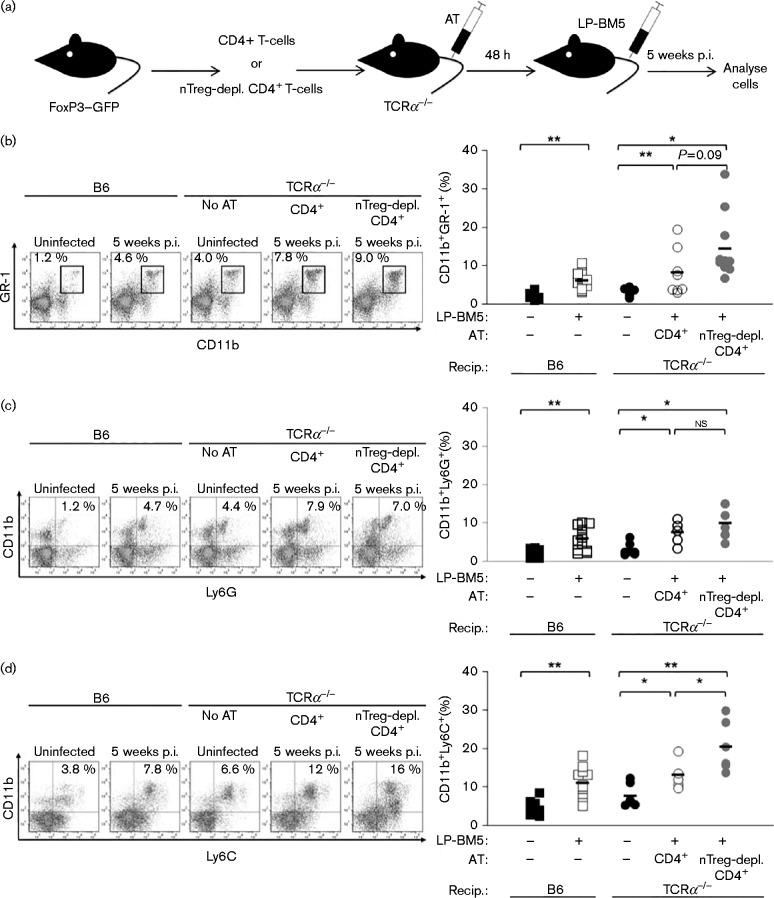
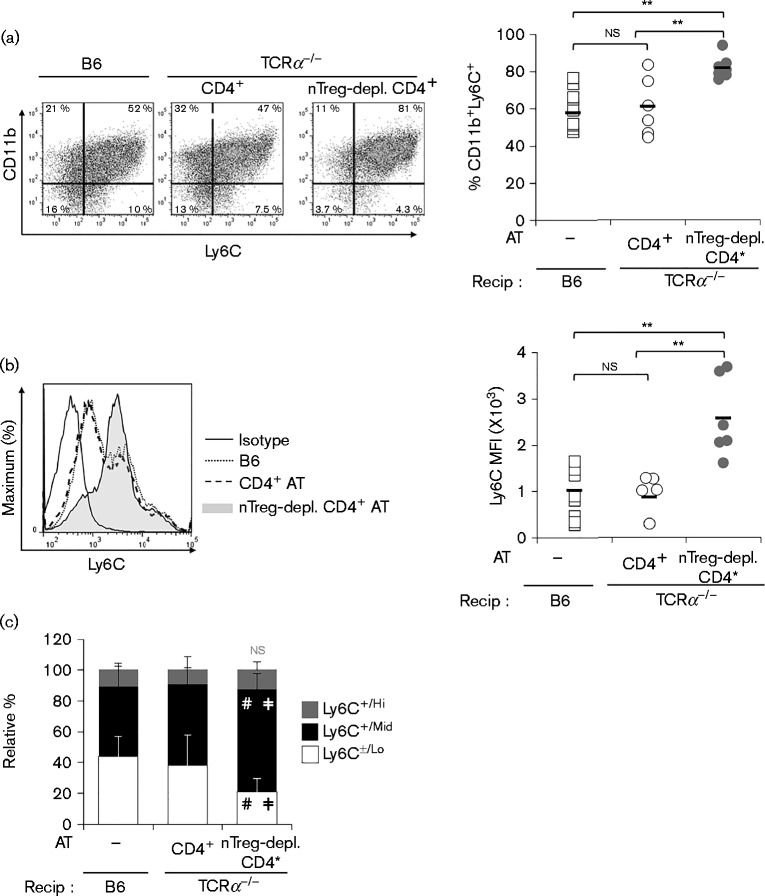
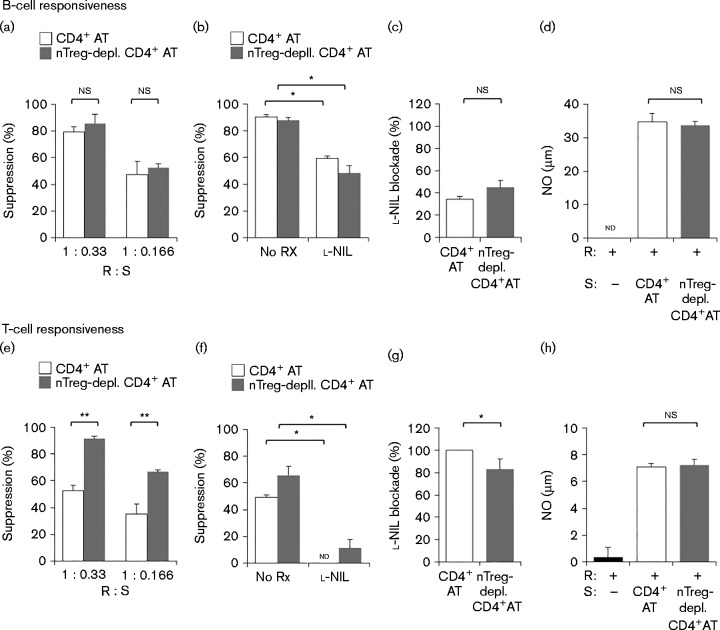
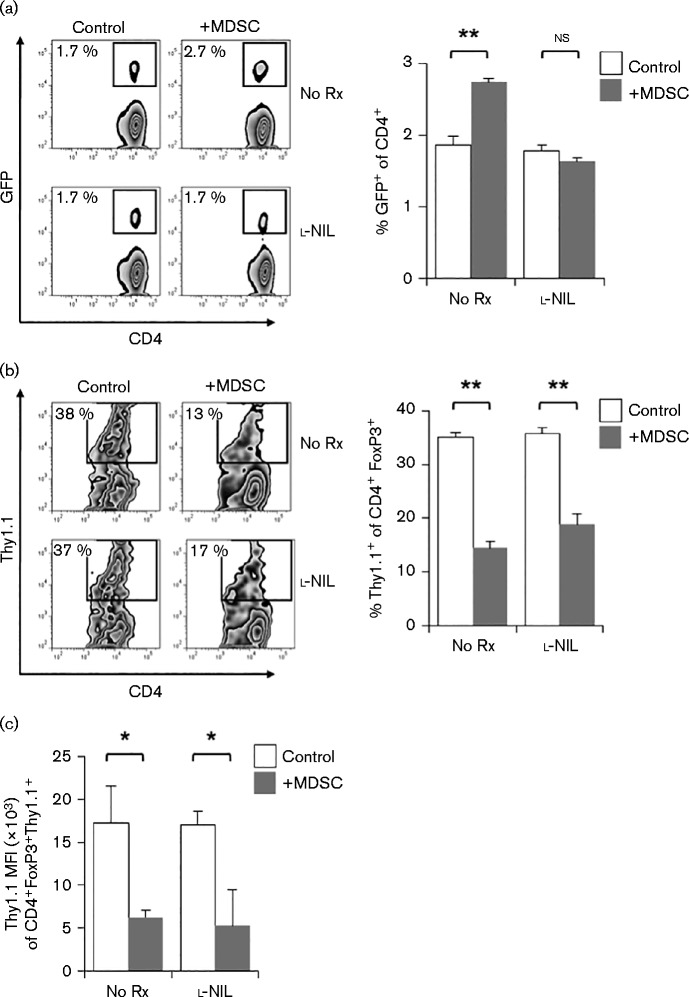
Immunomodulatory cellular subsets, including myeloid-derived suppressor cells (MDSCs) and T regulatory cells (Tregs), contribute to the immunosuppressive tumour microenvironment and are targets of immunotherapy, but their role in retroviral-associated immunosuppression is less well understood. Due to known crosstalk between Tregs and MDSCs in the tumour microenvironment, and also their hypothesized involvement during human immunodeficiency virus/simian immunodeficiency virus infection, studying the interplay between these immune cells during LP-BM5 retrovirus-induced murine AIDS is of interest. IL-10-producing FoxP3+ Tregs expanded after LP-BM5 infection. Following in vivo adoptive transfer of natural Treg (nTreg)-depleted CD4+T-cells, and subsequent LP-BM5 retroviral infection, enriched monocytic MDSCs (M-MDSCs) from these nTreg-depleted mice displayed altered phenotypic subsets. In addition, M-MDSCs from LP-BM5-infected nTreg-depleted mice exhibited increased suppression of T-cell, but not B-cell, responses, compared with M-MDSCs derived from non-depleted LP-BM5-infected controls. Additionally, LP-BM5-induced M-MDSCs modulated the production of IL-10 by FoxP3+ Tregs in vitro. These collective data highlight in vitro and for the first time, to the best of our knowledge, in vivo reciprocal modulation between retroviral-induced M-MDSCs and Tregs, and may provide insight into the immunotherapeutic targeting of such regulatory cells during retroviral infection.
Figures
Similar articles
-
Depletion of monocytic myeloid-derived suppressor cells in LP-BM5 murine retroviral infection has a positive impact on virus-induced host immunodeficiency.Virology. 2024 Dec;600:110247. doi: 10.1016/j.virol.2024.110247. Epub 2024 Sep 18. Virology. 2024. PMID: 39307098
-
LP-BM5 Retrovirus-Expanded Monocytic Myeloid-Derived Suppressor Cells Alter B Cell Phenotype and Function.Immunohorizons. 2018 Mar 30;2(3):87-106. doi: 10.4049/immunohorizons.1700066. Immunohorizons. 2018. PMID: 31022699
-
Myeloid-derived suppressor cells in murine retrovirus-induced AIDS inhibit T- and B-cell responses in vitro that are used to define the immunodeficiency.J Virol. 2013 Feb;87(4):2058-71. doi: 10.1128/JVI.01547-12. Epub 2012 Dec 5. J Virol. 2013. PMID: 23221564 Free PMC article.
-
Regulatory T cells in retroviral infections.PLoS Pathog. 2018 Feb 15;14(2):e1006776. doi: 10.1371/journal.ppat.1006776. eCollection 2018 Feb. PLoS Pathog. 2018. PMID: 29447279 Free PMC article. Review.
-
Tsl and LP-BM5: a comparison of two murine retrovirus models for HIV.Viral Immunol. 2001;14(2):95-109. doi: 10.1089/088282401750234475. Viral Immunol. 2001. PMID: 11398815 Review.
Cited by
-
Translational Potential of Therapeutics Targeting Regulatory Myeloid Cells in Tuberculosis.Front Cell Infect Microbiol. 2018 Sep 21;8:332. doi: 10.3389/fcimb.2018.00332. eCollection 2018. Front Cell Infect Microbiol. 2018. PMID: 30298121 Free PMC article. Review.
-
Granulocytic myeloid-derived suppressor cells suppress virus-specific CD8+ T cell responses during acute Friend retrovirus infection.Retrovirology. 2017 Aug 23;14(1):42. doi: 10.1186/s12977-017-0364-3. Retrovirology. 2017. PMID: 28835242 Free PMC article.
-
Depletion of monocytic myeloid-derived suppressor cells in LP-BM5 murine retroviral infection has a positive impact on virus-induced host immunodeficiency.Virology. 2024 Dec;600:110247. doi: 10.1016/j.virol.2024.110247. Epub 2024 Sep 18. Virology. 2024. PMID: 39307098
-
Intraperitoneal neutrophils activated by KRAS-induced ovarian cancer exert antitumor effects by modulating adaptive immunity.Int J Oncol. 2018 Oct;53(4):1580-1590. doi: 10.3892/ijo.2018.4504. Epub 2018 Jul 26. Int J Oncol. 2018. PMID: 30066851 Free PMC article.
-
Glutathione Depletion Is Linked with Th2 Polarization in Mice with a Retrovirus-Induced Immunodeficiency Syndrome, Murine AIDS: Role of Proglutathione Molecules as Immunotherapeutics.J Virol. 2016 Jul 27;90(16):7118-7130. doi: 10.1128/JVI.00603-16. Print 2016 Aug 15. J Virol. 2016. PMID: 27226373 Free PMC article.
References
-
- Allers K, Loddenkemper C, Hofmann J, Unbehaun A, Kunkel D, Moos V, Kaup F.-J, Stahl-Hennig C, Sauermann U, other authors (2010). Gut mucosal FOXP3+ regulatory CD4+T cells and nonregulatory CD4+T cells are differentially affected by simian immunodeficiency virus infection in rhesus macaques J Virol 843259–326910.1128/JVI.01715-09. - DOI - PMC - PubMed
-
- Bandera A, Ferrario G, Saresella M, Marventano I, Soria A, Zanini F, Sabbatini F, Airoldi M, Marchetti G, other authors (2010). CD4+T cell depletion, immune activation and increased production of regulatory T cells in the thymus of HIV-infected individuals PLoS One 5e10788.10.1371/journal.pone.0010788. - DOI - PMC - PubMed
Publication types
MeSH terms
Grants and funding
LinkOut - more resources
Full Text Sources
Other Literature Sources
Research Materials