. 2015 Aug 8:15:577.
doi: 10.1186/s12885-015-1546-9.

M1 and M2 macrophages derived from THP-1 cells differentially modulate the response of cancer cells to etoposide

Affiliations

M1 and M2 macrophages derived from THP-1 cells differentially modulate the response of cancer cells to etoposide

Marie Genin et al. BMC Cancer. .

Abstract

Background: Tumor associated macrophages (TAMs) are present in high density in solid tumors. TAMs share many characteristics with alternatively activated macrophages, also called M2. They have been shown to favor tumor development and a role in chemoresistance has also been suggested. Here, we investigated the effects of M2 in comparison to M1 macrophages on cancer cell sensitivity to etoposide.

Methods: We set up a model of macrophage polarization, starting from THP-1 monocytes differentiated into macrophages using PMA (Phorbol 12-myristate 13-acetate). Once differentiated (M0 macrophages), they were incubated with IL-4 and IL-13 in order to obtain M2 polarized macrophages or with IFN-gamma and LPS for classical macrophage activation (M1). To mimic the communication between cancer cells and TAMs, M0, M1 or M2 macrophages and HepG2 or A549 cancer cells were co-cultured during respectively 16 (HepG2) or 24 (A549) hours, before etoposide exposure for 24 (HepG2) or 16 (A549) hours. After the incubation, the impact of etoposide on macrophage polarization was studied and cancer cell apoptosis was assessed by western-blot for cleaved caspase-3 and cleaved PARP-1 protein, caspase activity assay and FACS analysis of Annexin V and PI staining.

Results: mRNA and protein expression of M1 and M2 markers confirmed the polarization of THP-1-derived macrophages, which provide a new, easy and well-characterized model of polarized human macrophages. Etoposide-induced cancer cell apoptosis was markedly reduced in the presence of THP-1 M2 macrophages, while apoptosis was increased in cells co-cultured with M1 macrophages. On the other hand, etoposide did not influence M1 or M2 polarization.

Conclusions: These results evidence for the first time a clear protective effect of M2 on the contrary to M1 macrophages on etoposide-induced cancer cell apoptosis.


Figures
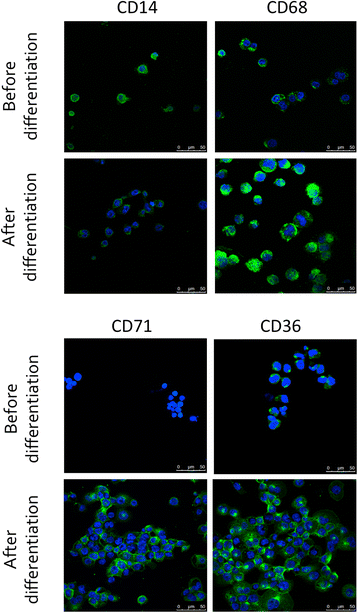
Fig. 1
Fig. 1
THP-1 monocyte differentiation in macrophages. THP-1 cells were incubated 24 h in the presence of 150 nM PMA and then in RPMI medium during 24 h. Cells were then fixed and immunolabeled for CD14, CD68, CD71 or CD36 using specific antibodies (green). Nuclei were detected with To-pro3 (blue)
Fig. 2
Fig. 2
Effects of IFN-γ and/or LPS on THP-1 macrophage viability after 16 or 24 h of incubation. THP-1 macrophages were incubated in RPMI medium with IFN-γ (20, 50 or 100 ng/ml) alone or in combination with LPS at different concentrations. After 16 and 24 h of incubation, cell viability was measured by a MTT assay. Results are expressed as means ± 1 S.D. (n = 3). Statistical analysis was carried out with a two-way ANOVA test followed by a Holm-Sidak post-test. * or ***: significantly different from the corresponding control (Ctrl) respectively with p < 0.05 or 0.001
Fig. 3
Fig. 3
M1 macrophage marker expression. THP-1 macrophages were incubated with IFN-γ (20, 50, 100 ng) and/or LPS 10 pg/ml during 24 h. (a) mRNA expression of M1 macrophage markers was studied by RT-qPCR and normalized by RPS9 expression. Results are expressed as means ± 1 S.D. (n = 3). (b) IL-6 and CXCL10 secretion in culture medium was measured by ELISA. Results are expressed as means ± 1 S.D. (n = 3). Statistical analysis was carried out with a one-way ANOVA test followed by a Holm-Sidak post-test. NS: not significantly different. *, ** or ***: significantly different from the corresponding control (Ctrl) respectively with p < 0.05, 0.01 or 0.001; ###: significantly different with p < 0.001. Statistical analyses were performed on non-transformed data for TNF-α (a), IL-1ß (a), IL-6 (b) and CXCL10 (b) and on log-transformed data for IL-6 (a), CXCL10 (a), CD80 (a) and HLD-DR (a)
Fig. 4
Fig. 4
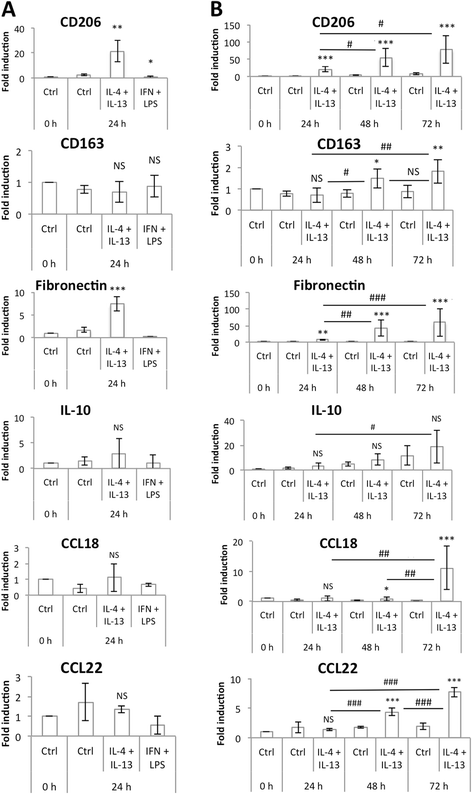
M2 macrophage marker mRNA expression. (a) THP-1 macrophages were incubated during 24 h either with IL-4 and IL-13 (20 ng/ml each) or with IFN-γ 20 ng/ml and LPS 10 pg/ml and mRNA expression of M2 macrophage markers was studied by RT-qPCR and normalized by RPS9 expression. Results are expressed as means ± 1 S.D. (n = 3). (b) THP-1 macrophages were incubated with IL-4 and IL-13 (20 ng/ml each) during 24, 48 or 72 h and mRNA expression of M2 macrophage markers was studied by RT-qPCR and normalized by RPS9 expression. Results are expressed as means ± 1 S.D. (n = 3). Statistical analysis was carried out with a one-way ANOVA for figure A and a two-way ANOVA for figure B, followed by a Holm-Sidak post-test. NS: not significantly different. *, ** or ***: significantly different from the corresponding control (Ctrl) respectively with p < 0.05, 0.01 or 0.001; ###: significantly different with p < 0.001. Statistical analyses were performed on log-transformed data for CD206 (b), fibronectin (b) and CCL18 (b)
Fig. 5
Fig. 5
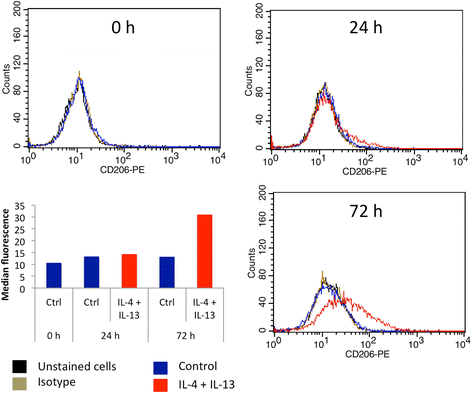
Cell surface CD206 expression by M2 macrophages. THP-1 macrophages were incubated during 24 or 72 h with control medium with or without IL-4 and IL-13. CD206 protein expression on macrophages was analyzed by flow cytometry with a specific antibody coupled to PE. Two controls were performed: some cells were unstained and others stained with a control isotype. The graph presents the histogram median of one of each sample
Fig. 6
Fig. 6
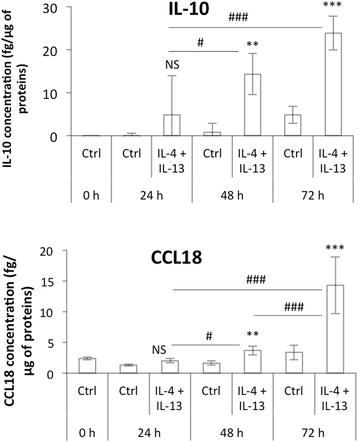
M2 macrophage secretion of IL-10 and CCL18. The IL-10 and CCL18 secretion in culture medium by macrophages was measured by ELISA. Results are expressed as means ± 1 S.D. (n = 3). Statistical analysis was carried out with a two-way ANOVA test, followed by a Holm-Sidak post-test. NS: not significantly different. ** or ***: significantly different from the corresponding control (Ctrl) respectively with p < 0.01 or 0.001; # or ###: significantly different respectively with p < 0.05 or 0.001. Statistical analyses were performed on log-transformed data for CCL18
Fig. 7
Fig. 7
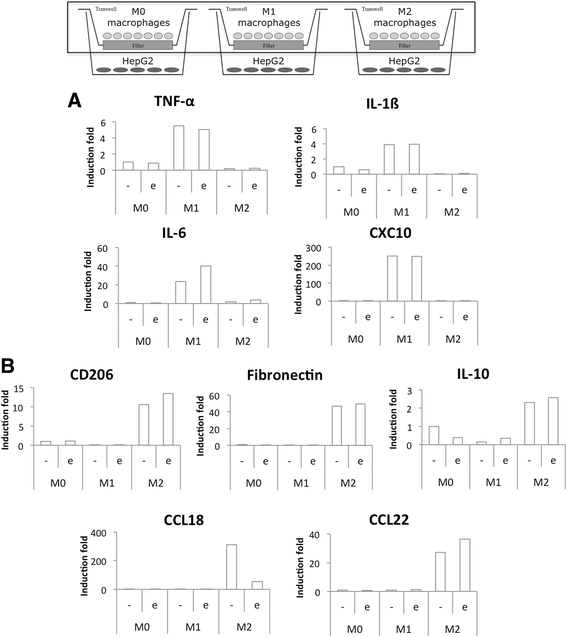
Study of M1 (a) and M2 (b) polarization marker mRNA expression in co-cultured macrophages. Macrophages were co-cultured in indirect contact with HepG2 cells during 16 h before incubation with or without 50 μM etoposide (+/− e) during 24 h. After the incubation, macrophage RNA was extracted, retro-transcribed and the mRNA expression of M1 and M2 macrophage markers was studied by RT-qPCR (n = 1)
Fig. 8
Fig. 8
Study of M1 (a) and M2 (b) polarization markers mRNA expression in etoposide-incubated macrophages. THP-1 macrophages were differentiated (M0) and polarized in M1 and M2 macrophages by respectively 24 h with IFN-γ (20 ng/ml) + LPS (10 pg/ml) (M1) and 72 h with IL-4 and IL-13 (20 ng/ml each- M2)). Once polarized, they were incubated in CO2-independent medium (+3,75 g D-glucose/l) during 16 h before incubation with or without 50 μM etoposide (+/− e) during 24 h. After the incubation, mRNA expression of M1 and M2 macrophage markers was studied by RT-qPCR and normalized by RPS9 expression. Results are expressed as means ± 1 S.D. (n = 3). Statistical analysis was carried out with the two-way ANOVA test followed by a Holm-Sidak post-test NS: not significantly different. *: significantly different from the corresponding control with p < 0.05; ## or ###: significantly different respectively with p < 0.01 or 0.001. Statistical analyses were performed on log-transformed data for all the genes
Fig. 9
Fig. 9
Modulation of HepG2 cell apoptosis induced by etoposide by co-cultured M0, M1 and M2 macrophages. Macrophages were co-cultured in indirect contact with HepG2 cells during 16 h before incubation with or without 50 μM etoposide (+/− e) during 24 h. (a) HepG2 cell proteins were extracted and PARP-1 and caspase-3 protein abundance was assessed by western blotting using specific antibodies. ß-actin was used as loading control. Graphs represent the quantification of cleaved PARP-1 and cleaved caspase-3 abundance normalized by the corresponding ß-actin in three independent experiences. Results are expressed as mean ± 1 S.D. (n = 3). (b) After the incubation with etoposide, caspase-3 and-7 activity was assayed in HepG2 cells by measuring the fluorescence intensity of free AFC released from the cleavage of Ac-DEVD-AFC. Results are expressed in relative caspase-3/-7 activity as mean ± 1 S.D. (n = 3). Statistical analysis was carried out with the one-way ANOVA test followed by a Holm-Sidak post-test. NS: no significantly different from control cells incubated with etoposide; * or **: significantly different from control cells incubated with etoposide respectively with p < 0.05 or 0.01
Fig. 10
Fig. 10
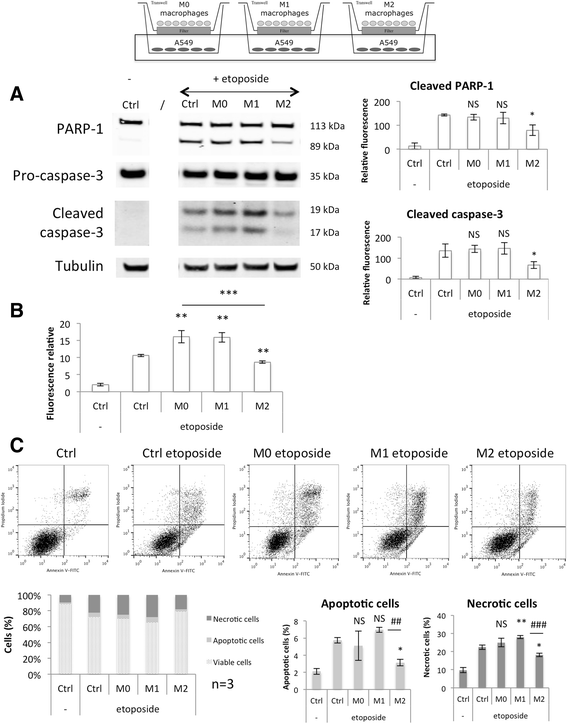
Modulation of A549 cell apoptosis induced by etoposide by co-cultured M0, M1 and M2 macrophages. Macrophages were co-cultured in indirect contact with A549 cells during 24 h before incubation with or without 50 μM etoposide (+/− e) during 16 h. (a) A549 cell proteins were extracted and PARP-1 and caspase-3 protein abundance was assessed by western blotting using specific antibodies. α-tubulin was used as loading control. Graphs represent the quantification of cleaved PARP-1 and cleaved caspase-3 abundance normalized by the corresponding α-tubulin in three independent experiences. Results are expressed as mean ± 1 S.D. (n = 3). (b) After the incubation with etoposide, caspase-3 and-7 activity was assayed in A549 cells by measuring the fluorescence intensity of free AFC released from the cleavage of Ac-DEVD-AFC. Results are expressed in relative caspase-3/-7 activity as mean ± 1 S.D. (n = 3). (c) After the incubation with macrophages, A549 cells were detached and stained with Annexin V-FITC and propidium iodide before fluorescence analysis by flow cytometry. The percentage of cells in the four different quadrants was calculated and the results present in different histograms where viable cells are Annexin V-/PI-, apoptotic cells Annexin V+/PI- and necrotic cells are PI +. Results are present as mean ± 1 S.D. (n = 3). Statistical analysis was carried out with the one-way ANOVA test followed by a Holm-Sidak post-test. NS: no significantly different from control cells incubated with etoposide; *, ** or ***: significantly different from control cells incubated with etoposide respectively with p < 0.05, 0.01 or 0.001

References

    1. Gordon S. The macrophage: past, present and future. Eur J Immunol. 2007;37(Suppl 1):S9–17. doi: 10.1002/eji.200737638. - DOI - PubMed
    1. Gordon S, Taylor PR. Monocyte and macrophage heterogeneity. Nat Rev Immunol. 2005;5(12):953–64. doi: 10.1038/nri1733. - DOI - PubMed
    1. Mantovani A, Sozzani S, Locati M, Allavena P, Sica A. Macrophage polarization: tumor-associated macrophages as a paradigm for polarized M2 mononuclear phagocytes. Trends Immunol. 2002;23(11):549–55. doi: 10.1016/S1471-4906(02)02302-5. - DOI - PubMed
    1. Gordon S. Alternative activation of macrophages. Nat Rev Immunol. 2003;3(1):23–35. doi: 10.1038/nri978. - DOI - PubMed
    1. Biswas SK, Allavena P, Mantovani A. Tumor-associated macrophages: functional diversity, clinical significance, and open questions. Semin Immunopathol. 2013;35(5):585–600. doi: 10.1007/s00281-013-0367-7. - DOI - PubMed

Publication types