. 2015 Oct;218(Pt 19):3010-22.
doi: 10.1242/jeb.104646. Epub 2015 Aug 7.

How do treadmill speed and terrain visibility influence neuromuscular control of guinea fowl locomotion?

Affiliations

How do treadmill speed and terrain visibility influence neuromuscular control of guinea fowl locomotion?

Joanne C Gordon et al. J Exp Biol. 2015 Oct.

Abstract

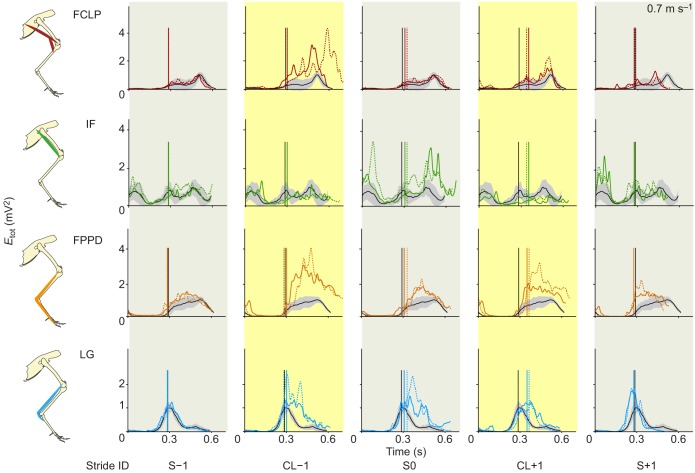
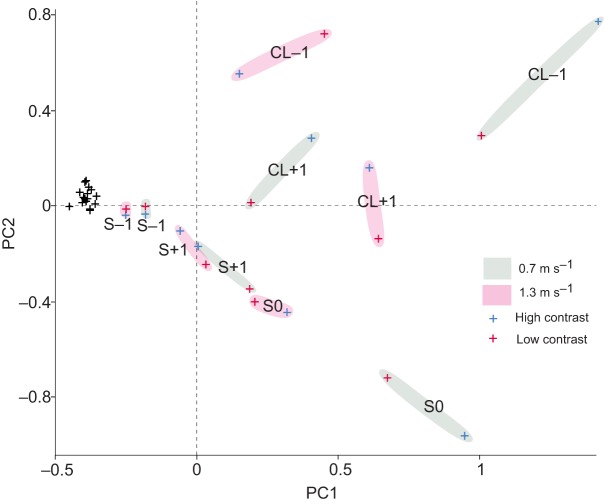
Locomotor control mechanisms must flexibly adapt to both anticipated and unexpected terrain changes to maintain movement and avoid a fall. Recent studies revealed that ground birds alter movement in advance of overground obstacles, but not treadmill obstacles, suggesting context-dependent shifts in the use of anticipatory control. We hypothesized that differences between overground and treadmill obstacle negotiation relate to differences in visual sensory information, which influence the ability to execute anticipatory manoeuvres. We explored two possible explanations: (1) previous treadmill obstacles may have been visually imperceptible, as they were low contrast to the tread, and (2) treadmill obstacles are visible for a shorter time compared with runway obstacles, limiting time available for visuomotor adjustments. To investigate these factors, we measured electromyographic activity in eight hindlimb muscles of the guinea fowl (Numida meleagris, N=6) during treadmill locomotion at two speeds (0.7 and 1.3 m s(-1)) and three terrain conditions at each speed: (i) level, (ii) repeated 5 cm low-contrast obstacles (<10% contrast, black/black), and (iii) repeated 5 cm high-contrast obstacles (>90% contrast, black/white). We hypothesized that anticipatory changes in muscle activity would be higher for (1) high-contrast obstacles and (2) the slower treadmill speed, when obstacle viewing time is longer. We found that treadmill speed significantly influenced obstacle negotiation strategy, but obstacle contrast did not. At the slower speed, we observed earlier and larger anticipatory increases in muscle activity and shifts in kinematic timing. We discuss possible visuomotor explanations for the observed context-dependent use of anticipatory strategies.

Keywords: Bipedal; Bird; Muscle; Numida meleagris; Stability; Visuomotor control.


Conflict of interest statement

Competing interests

The authors declare no competing or financial interests.

Figures

Fig. 1.
Fig. 1.
Schematic diagram of guinea fowl hindlimb anatomy and EMG electrode placement. (A) Muscle anatomy and placement of the eight electrodes. (B) Skeletal anatomy with each muscle's line of action to illustrate origin and insertion. The dashed line represents the medial section of the proximal head of the medial gastrocnemius (MG).
Fig. 2.
Fig. 2.
A representative four-stride sequence of raw EMG data recorded from eight guinea fowl hindlimb muscles during treadmill obstacle negotiation in the high-contrast, slower speed condition. Grey shaded regions indicate stance phase of the instrumented limb. Data are shown for one of two possible stride sequences (see Fig. 3) as the bird approaches, steps onto and steps over the obstacle. The recording limb underwent stance phase on top of the obstacle in stride ID ‘S0’.
Fig. 3.
Fig. 3.
Schematic representation of the two possible stride sequences of the instrumented right limb during obstacle negotiation, depicted from an ‘overhead’ foot step view. Data cutting points are indicated by vertical black lines. The obstacle footfall event is outlined in red. The bottom panel depicts the obstacle stride footfall sequence (‘S’), in which the instrumented right leg enters a stance phase on the obstacle (S0), and the non-recording left leg undergoes stance directly before and after the obstacle. The top panel depicts the alternative contralateral footfall stride sequence (‘CL’), in which the instrumented right leg undergoes stance directly before (CL−1) and after (CL+1) the obstacle, whereas the non-recording leg enters stance on the obstacle. The middle panel shows these stride sequences interleaved, where instrumented limb data are used to produce a complete bilateral obstacle negotiation sequence, assuming symmetry between the right and left legs. Stride IDs shown in the middle panel are used in subsequent figures.
Fig. 4.
Fig. 4.
Change in total myoelectric intensity per stride (Etot) during obstacle negotiation in the lateral gastrocnemius (LG), as a fractional difference from mid-flat strides. (A) Changes in LG Etot at the slower speed (top) and higher speed (bottom) for the bilateral obstacle negotiation sequence (B; see Fig. 3). Low- and high-contrast obstacle conditions in A are shown with solid and dotted bars, respectively. Bars indicate grand mean differences from mid-flat strides, with error bars indicating s.e.m. and asterisks for statistically significant post hoc pairwise differences from mid-flat strides (P≤0.05).
Fig. 5.
Fig. 5.
Changes in Etot during obstacle negotiation as a fractional difference from mid-flat strides, for all eight recorded hindlimb muscles. (A) Changes in Etot at the slower speed (top) and higher speed (bottom) for the bilateral obstacle negotiation sequence (B; see Fig. 3). Colour legend as in Fig. 1, with solid and dotted bars indicating low- and high-contrast obstacle conditions, respectively. Bars indicate grand mean differences in Etot from mid-flat strides, with error bars indicating s.e.m. and asterisks showing statistically significant post hoc pairwise differences from mid-flat strides (P≤0.05).
Fig. 6.
Fig. 6.
Average trajectories of muscle activation during slower speed obstacle negotiation for four hindlimb muscles. Stride sequence as shown in Fig. 3. Traces are grand means of Etot as a function of time, shown for mid-flat strides (black with grey 95% confidence interval), low-contrast obstacle strides (solid coloured lines) and high-contrast obstacle strides (dashed coloured lines). Vertical lines indicate toe-down time (solid black for level, solid coloured for low-contrast obstacles and dashed coloured for high-contrast obstacles). We show four muscles here to represent the main patterns observed across the limb; see supplementary material Fig. S1 for the remaining muscles.
Fig. 7.
Fig. 7.
Average trajectories of muscle activation during higher speed obstacle negotiation for four hindlimb muscles. Colours and lines as in Fig. 6; see supplementary material Fig. S2 for the remaining muscles.
Fig. 8.
Fig. 8.
Principal component analysis of variance in Etot across eight hindlimb muscles and all measured terrain conditions. Scores for the first two principal components (PC1 and PC2) explain 75% of the variance in Etot across muscles, terrains and stride categories, indicating high covariance of limb muscle activity. Scores for PC1 are shown against those for PC2 for each stride category, with black ‘+’ for level terrain and mid-flat strides, blue ‘+’ for high-contrast obstacle strides and red ‘+’ for low-contrast obstacle strides. Shaded regions indicate clusters associated with speed and stride ID, illustrating speed-specific differences in obstacle negotiation strategy, but relatively lower variance associated with obstacle contrast. See Results for further details.
Fig. 9.
Fig. 9.
Changes in kinematic timing: stride duration, swing duration and stance duration during obstacle negotiation. Changes in duration are shown at the slower speed (A) and higher speed (B). Stride sequence as shown in Fig. 3, with solid and dotted bars for low- and high- contrast obstacles, respectively. Bars indicate the grand mean difference from mid-flat strides, with error bars indicating s.e.m. and asterisks for statistically significant post hoc pairwise differences from mid-flat strides (P<0.05).

References

    1. Akaike H. (1976). An information criterion (AIC). Math. Sci. 14, 5-9.
    1. Belmonti V., Cioni G. and Berthoz A. (2013). Development of anticipatory orienting strategies and trajectory formation in goal-oriented locomotion. Exp. Brain Res. 227, 131-147. 10.1007/s00221-013-3495-3 - DOI - PubMed
    1. Birn-Jeffery A. V. (2012). Scaling of running stability and limb posture with body size in galliform birds. PhD Thesis, Royal Veterinary College, UK.
    1. Birn-Jeffery A. V. and Daley M. A. (2012). Birds achieve high robustness in uneven terrain through active control of landing conditions. J. Exp. Biol. 215, 2117-2127. 10.1242/jeb.065557 - DOI - PubMed
    1. Birn-Jeffery A. V., Hubicki C. M., Blum Y., Renjewski D., Hurst J. W. and Daley M. A. (2014). Don't break a leg: running birds from quail to ostrich prioritise leg safety and economy on uneven terrain. J. Exp. Biol. 217, 3786-3796. 10.1242/jeb.102640 - DOI - PMC - PubMed

Publication types

LinkOut - more resources