. 2015 Sep 24;126(13):1565-74.
doi: 10.1182/blood-2015-04-639542. Epub 2015 Aug 7.

Synergistic activity of BET protein antagonist-based combinations in mantle cell lymphoma cells sensitive or resistant to ibrutinib

Affiliations

Synergistic activity of BET protein antagonist-based combinations in mantle cell lymphoma cells sensitive or resistant to ibrutinib

Baohua Sun et al. Blood. .

Erratum in

Abstract

Mantle cell lymphoma (MCL) cells exhibit increased B-cell receptor and nuclear factor (NF)-κB activities. The bromodomain and extra-terminal (BET) protein bromodomain 4 is essential for the transcriptional activity of NF-κB. Here, we demonstrate that treatment with the BET protein bromodomain antagonist (BA) JQ1 attenuates MYC and cyclin-dependent kinase (CDK)4/6, inhibits the nuclear RelA levels and the expression of NF-κB target genes, including Bruton tyrosine kinase (BTK) in MCL cells. Although lowering the levels of the antiapoptotic B-cell lymphoma (BCL)2 family proteins, BA treatment induces the proapoptotic protein BIM and exerts dose-dependent lethality against cultured and primary MCL cells. Cotreatment with BA and the BTK inhibitor ibrutinib synergistically induces apoptosis of MCL cells. Compared with each agent alone, cotreatment with BA and ibrutinib markedly improved the median survival of mice engrafted with the MCL cells. BA treatment also induced apoptosis of the in vitro isolated, ibrutinib-resistant MCL cells, which overexpress CDK6, BCL2, Bcl-xL, XIAP, and AKT, but lack ibrutinib resistance-conferring BTK mutation. Cotreatment with BA and panobinostat (pan-histone deacetylase inhibitor) or palbociclib (CDK4/6 inhibitor) or ABT-199 (BCL2 antagonist) synergistically induced apoptosis of the ibrutinib-resistant MCL cells. These findings highlight and support further in vivo evaluation of the efficacy of the BA-based combinations with these agents against MCL, including ibrutinib-resistant MCL.


Figures

Figure 1
Figure 1
Treatment with the BET antagonists JQ1 and I-BET151 induces cell-cycle growth arrest and lethal effects in cultured MCL cells. (A) Cell-cycle status of MO2058 (left) and Mino (right) cells following 24 hours of treatment with JQ1, as indicated. Columns, mean of 3 independent experiments; Bars, ± standard error of the mean (SEM). (B) MO2058 and Mino cells were cultured in the presence or absence of 1.0 µM of JQ1 and cell counts were measured every 24 hours for 120 hours. Lines represent the mean cell number from 3 experiments ± standard deviation (SD). (C) MO2058, JeKo-1, Mino, and Z-138 cells were treated with the indicated concentrations of JQ1 for 48 hours. The percent of Annexin V-positive apoptotic cells was determined by flow cytometry. Columns, mean of 3 independent experiments; Bars, ± SEM. (D) MO2058 and JeKo-1 cells were treated with the indicated concentrations of I-BET151 for 48 hours. Annexin V-positive apoptotic cells were determined by flow cytometry. Columns, mean of 3 independent experiments; Bars, ± SEM. IC50 values were calculated using GraphPad Prism software (version 5). (E) Primary MCL cells were treated with the indicated concentrations of JQ1 for 48 hours. The percent of nonviable cells was determined by flow cytometry. Columns, mean percent loss of viability of 6 primary MCL samples; Bars, ± SEM. (F) MO2058 (left) and Mino (right) cells were cocultured with or without HS5 stromal cells and then treated with JQ1, as indicated, for 48 hours. The percent of apoptosis of the MO2058 and Mino or HS5 cells was determined by staining with Annexin V and TO-PRO-3 iodide and flow cytometry. Columns represent the mean apoptosis of 3 independent experiments; Bars, ± SEM. (G) Primary MCL cells were cocultured with or without HK stromal cells and then treated with JQ1 for 48 hours. The percent of nonviable cells was determined by PI staining and flow cytometry. Asterisk (*) indicates loss of viability values significantly less (P < .05) in cells cocultured with HK stromal cells compared with those without coculture.
Figure 2
Figure 2
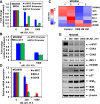
Treatment with JQ1 reduces BRD4 and Pol II occupancy on the promoters of c-MYC and BCL2, and depletes the mRNA expression of c-MYC and BCL2 in human MCL cells. (A-B) MO2058 cells were treated with the indicated concentrations of JQ1 for 16 hours. Following this, ChIP was conducted with a BRD4-specific antibody (A) or RNAP2 antibody (B). The ChIP DNA was subjected to real-time qPCR with primers against the enhancer and promoter of c-MYC and the promoter of BCL2. The fold-change was calculated using the cycle threshold (Ct) value of the ChIP DNA compared with the Ct value of the input DNA. (C) MO2058 cells were treated with 1000 nM of JQ1 for 8 hours. Total RNA was extracted and used for gene expression analyses. A heat map of TNFAIP3, MYC, CDK4, BCL2, CDK6, and HEXIM1 is shown. (D) MO2058 cells were treated with the indicated concentrations of JQ1 for 16 hours. At the end of treatment, RNA was isolated and reverse transcribed. The resulting cDNA was used for real-time qPCR analysis of c-MYC, BCL-2, and CDK6. The relative mRNA expression was normalized to GAPDH and compared with the untreated cells. (E) Representative immunoblots of MO2058 cells treated with the indicated concentrations of JQ1 for 24 hours. Immunoblot analyses were conducted for the expression levels of c-MYC, MCL1, CDK4, CDK6, HEXIM1, p21, p27, BIM, and β-actin in the cell lysates.
Figure 3
Figure 3
Treatment with BET antagonist reduces nuclear expression of RelA and BTK, and depletes mRNA expression of NF-kB target genes in MCL cells. (A) Confocal immunofluorescence analysis of RelA expression and cellular localization in Mino cells following treatment with JQ1 for 24 hours. Original magnification, ×63. The bar graph (right) shows quantification of the fluorescein isothiocyanate signal intensity of the JQ1-treated Mino cells relative to the untreated cells. (B) Mino cells were treated with the indicated concentrations of JQ1 for 24 hours (top). Following this, nuclear and cytoplasmic fractions were prepared and immunoblot analyses were conducted for BTK and RelA. The localization of Lamin B served as a fraction and loading control. The graph (bottom) shows the relative expression of p-BTK and BTK in the nucleus, determined by densitometry and normalized against the expression of Lamin B. Representative immunoblots are shown. (C) qPCR performed on cDNA from Mino cells treated with the indicated concentrations of JQ1 for 8 hours. Relative expression of each target was normalized against GAPDH. (D) Immunoblot analyses were conducted on the lysates of MO2058 (left) and Mino (right) cells treated with JQ1 for 24 hours, as indicated. The numbers beneath the bands represent densitometry analysis performed on the blots and normalized to the β-actin loading control. Cyto, cytoplasmic; DAPI, 4′,6 diamidino-2-phenylindole; Nuc, nuclear.
Figure 4
Figure 4
Compared with treatment with either agent alone, combined treatment with JQ1 and ibrutinib exerts synergistic lethal activity against cultured and primary MCL cells. (A) Representative immunoblots from Mino cells treated with JQ1 and/or ibrutinib, as indicated, for 24 hours. The numbers beneath the bands represent densitometry analysis performed on the blots and normalized to the β-actin loading control. (B) Mino cells were treated with JQ1 and/or ibrutinib for 24 hours. Confocal immunofluorescence microscopy was performed for RelA subcellular localization. Nuclei were stained with DAPI. Original magnification, ×63. (C) Nuclear and cytosolic fractions were prepared from Mino cells treated as indicated for 24 hours and the expression levels of RelA in each fraction were determined by immunoblot analyses. The localization of Lamin B served as a fraction and loading control. (D) MO2058, JeKo-1, and Mino cells were treated with JQ1 and ibrutinib at a constant ratio for 48 hours. The percent of apoptotic cells was determined by flow cytometry. Median dose effect and isobologram analyses were performed utilizing CalcuSyn. CI values <1.0 indicates a synergistic interaction of the two agents in the combination. Doses of drugs, fractional effect, and CI values are provided in supplemental Figure 6A. (E) Primary MCL cells were treated with JQ1 and ibrutinib at a constant ratio for 48 hours. The percent of nonviable cells was determined by flow cytometry. Median dose effect and isobologram analyses were performed utilizing CalcuSyn. CI values <1.0 indicates a synergistic interaction of the two agents in the combination. (F) Primary MCL cells were treated with the indicated concentrations of JQ1 and/or ibrutinib for 24 hours. Then, total cell lysates were prepared and immunoblot analyses were conducted as indicated. The numbers beneath the bands represent densitometry analysis performed on the blots and normalized to the β-actin loading control. Cyto, cytoplasmic; DAPI, 4′,6 diamidino-2-phenylindole; FE, fractional effect; Nuc, nuclear.
Figure 5
Figure 5
Compared with either single agent alone, cotreatment with JQ1 and ibrutinib exerts superior in vivo anti-MCL activity against Mino xenografts. (A) NOD/SCID mice (n = 8 per cohort) were injected with Mino cells and monitored for 7 days. Following engraftment, mice were treated with JQ1 and/or ibrutinib for 3 weeks as described in supplemental Methods. Survival of the mice is represented by a Kaplan–Meier plot. Vehicle vs JQ1, P = .003, Student t test; vehicle vs ibrutinib, P = .0204, Student t test. Mantel–Cox rank sum of all groups, P .0013. (B) Immunoblot analyses conducted on the spleen and BM from NOD/SCID mice injected with Mino cells as above, and treated with JQ1 and/or ibrutinib for 1 week. Vertical line(s) have been inserted to indicate a repositioned gel lane. Ibr, ibrutinib; Veh, vehicle.
Figure 6
Figure 6
Cotreatment with JQ1 and PS or palbociclib is synergistically active in ibrutinib-resistant Mino/IR cells. (A) Representative immunoblots of basal protein expression in Mino vs Mino/IR cells. (B) Mino and Mino cells with acquired resistance to ibrutinib (Mino/IR) were treated with the indicated concentrations of JQ1 for 48 hours. The percent of Annexin V-positive apoptotic cells was determined by flow cytometry. (C) Immunoblot analyses of Mino and Mino/IR cells treated for 24 hours with JQ1, as indicated. The numbers beneath the bands represent densitometry analysis. (D-G) Mino/IR cells were treated with a fixed ratio of JQ1 and PS (D), or palbociclib (E), or ABT-737 (F), or ABT-199 (G) for 48 hours. The percent of apoptotic cells was determined by flow cytometry. Median dose effect and isobologram analyses were performed. CI values <1.0 indicates a synergistic interaction of the two agents in the combination. Doses of drugs, fractional effect, and CI values are provided in supplemental Figure 6B. n.s., not significant.
Figure 7
Figure 7
Cotreatment with JQ1 and ABT-199 or palbociclib is synergistically active against primary MCL cells. (A-B) Primary MCL cells were treated with the indicated concentrations of JQ1 and the BCL2-specific inhibitor, ABT-199 or the CDK4/6 inhibitor, palbociclib at a fixed ratio for 48 hours. At the end of treatment, cells were washed with 1× phosphate-buffered saline and stained with PI. The percent of nonviable cells was determined by flow cytometry. Median dose effect and isobologram analyses were performed. CI values <1.0 indicates a synergistic interaction of the two agents in the combination. FE, fractional effect.

Similar articles

Cited by

References

    1. Pérez-Galán P, Dreyling M, Wiestner A. Mantle cell lymphoma: biology, pathogenesis, and the molecular basis of treatment in the genomic era. Blood. 2011;117(1):26–38. - PMC - PubMed
    1. Jares P, Colomer D, Campo E. Molecular pathogenesis of mantle cell lymphoma. J Clin Invest. 2012;122(10):3416–3423. - PMC - PubMed
    1. Beà S, Valdés-Mas R, Navarro A, et al. Landscape of somatic mutations and clonal evolution in mantle cell lymphoma. Proc Natl Acad Sci USA. 2013;110(45):18250–18255. - PMC - PubMed
    1. Rossi D, Ciardullo C, Gaidano G. Genetic aberrations of signaling pathways in lymphomagenesis: revelations from next generation sequencing studies. Semin Cancer Biol. 2013;23(6):422–430. - PubMed
    1. Kridel R, Meissner B, Rogic S, et al. Whole transcriptome sequencing reveals recurrent NOTCH1 mutations in mantle cell lymphoma. Blood. 2012;119(9):1963–1971. - PubMed

Publication types

MeSH terms

Substances