

Cheminformatic comparison of approved drugs from natural product versus synthetic origins
- PMID: 26254944
- PMCID: PMC4607632
- DOI: 10.1016/j.bmcl.2015.07.014
Cheminformatic comparison of approved drugs from natural product versus synthetic origins
Abstract
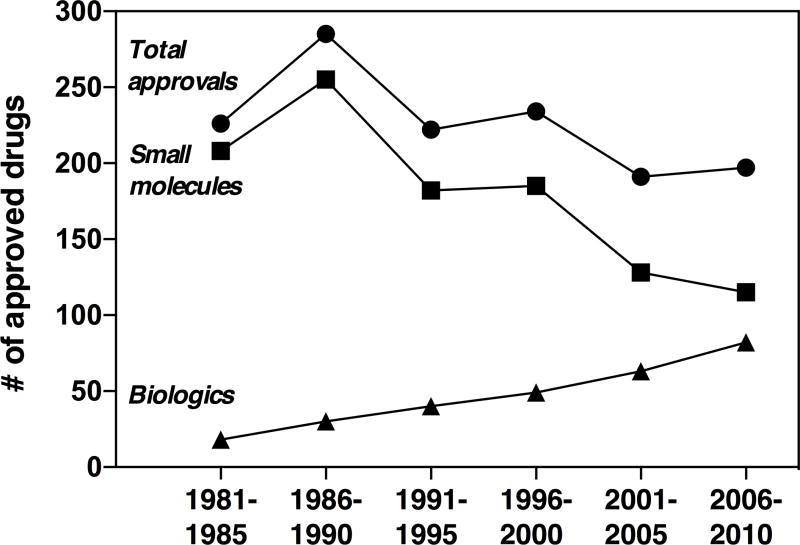
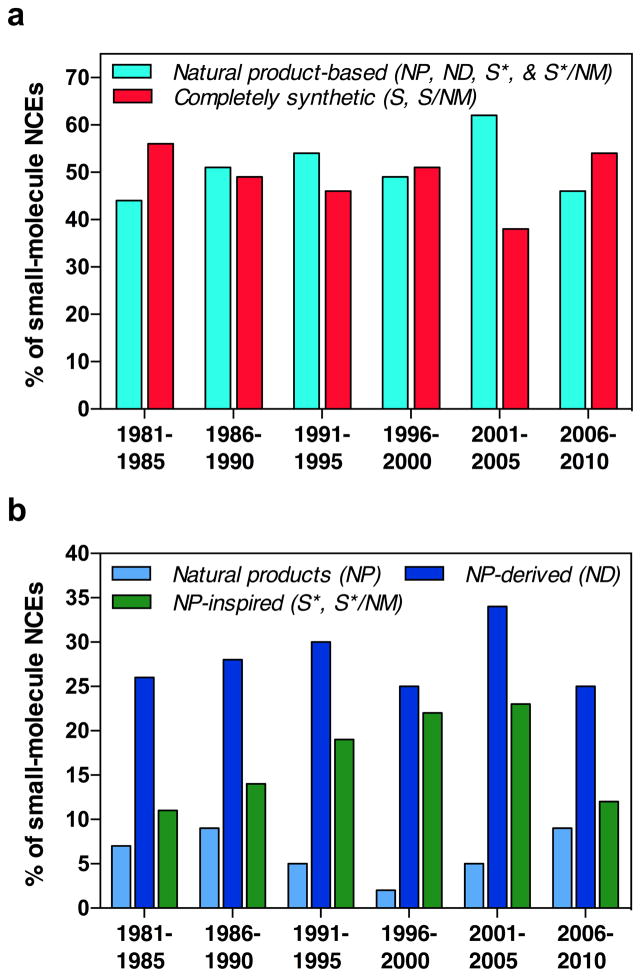
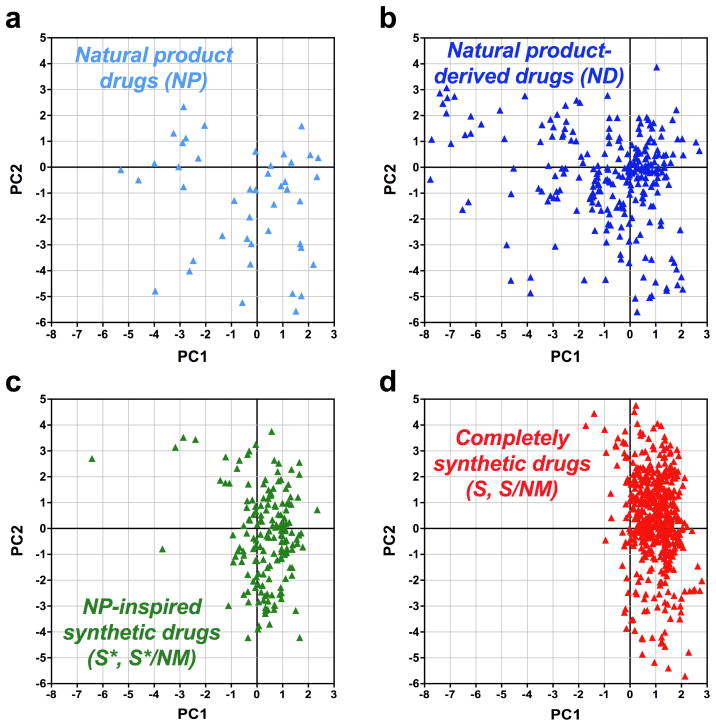
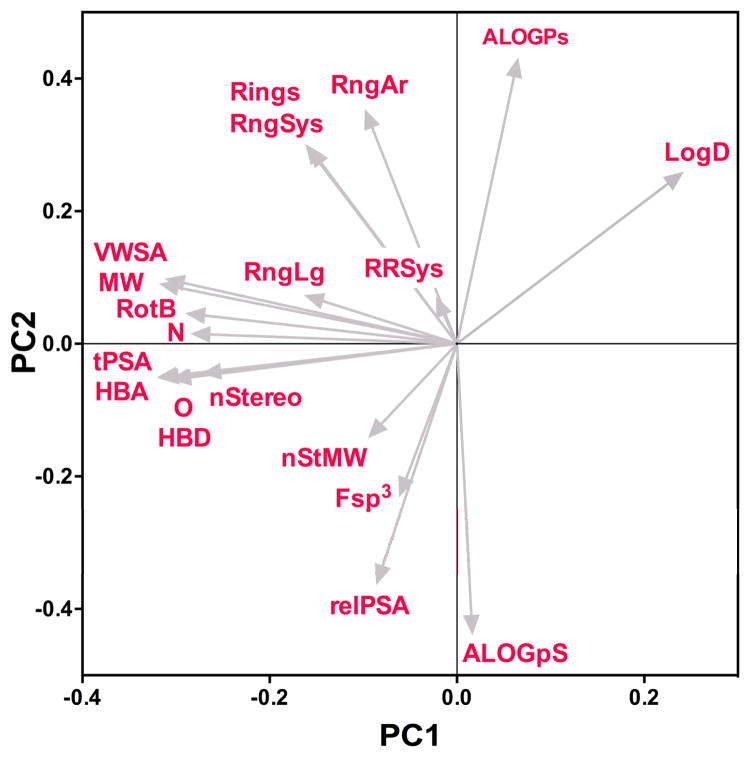
Despite the recent decline of natural product discovery programs in the pharmaceutical industry, approximately half of all new drug approvals still trace their structural origins to a natural product. Herein, we use principal component analysis to compare the structural and physicochemical features of drugs from natural product-based versus completely synthetic origins that were approved between 1981 and 2010. Drugs based on natural product structures display greater chemical diversity and occupy larger regions of chemical space than drugs from completely synthetic origins. Notably, synthetic drugs based on natural product pharmacophores also exhibit lower hydrophobicity and greater stereochemical content than drugs from completely synthetic origins. These results illustrate that structural features found in natural products can be successfully incorporated into synthetic drugs, thereby increasing the chemical diversity available for small-molecule drug discovery.
Keywords: Cheminformatics; Natural products; Physicochemical properties; Principal component analysis; Synthetic drugs.
Copyright © 2015 Elsevier Ltd. All rights reserved.
Figures
References
-
- Munos B. Nat Rev Drug Discov. 2009;8:959. - PubMed
-
- Scannell JW, Blanckley A, Boldon H, Warrington B. Nat Rev Drug Discov. 2012;11:191. - PubMed
-
- DiMasi JA, Grabowski HG, Hansen RW. Cost to develop and win marketing approval for a new drug is $2.6 billion. http://csdd.tufts.edu.
-
- Newman DJ, Cragg GM. J Nat Prod. 2007;70:461. - PubMed
Publication types
MeSH terms
Substances
Grants and funding
LinkOut - more resources
Full Text Sources
Other Literature Sources
Medical
