

Review
doi: 10.1186/s12968-015-0172-7.
Cardiovascular magnetic resonance phase contrast imaging
Affiliations
- PMID: 26254979
- PMCID: PMC4529988
- DOI: 10.1186/s12968-015-0172-7
Item in Clipboard
Review
Cardiovascular magnetic resonance phase contrast imaging
J Cardiovasc Magn Reson.
.
Abstract
Cardiovascular magnetic resonance (CMR) phase contrast imaging has undergone a wide range of changes with the development and availability of improved calibration procedures, visualization tools, and analysis methods. This article provides a comprehensive review of the current state-of-the-art in CMR phase contrast imaging methodology, clinical applications including summaries of past clinical performance, and emerging research and clinical applications that utilize today's latest technology.
Figures
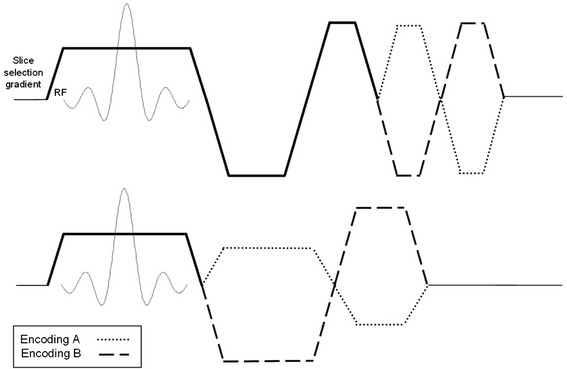
MR images are sensitized to measure the through-plane component of velocity by applying a flow-encoding gradient to the slice-selection axis of the pulse sequence. The flow encoding gradient can be added as (top) a bipolar pair to a flow-compensated slice selection waveform, or (bottom) to reduce minimum TE, combined with other gradient lobes
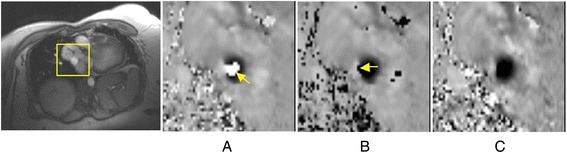
Difficulty where wraparound is not an “island” in the flow: a Peak flow through a mildly narrowed pulmonary vein showing velocity aliasing of black into white (arrow) at VENC 80 cm/s. b Unwrapping this aliasing was uncertain in partial-volume pixels neighboring the reverse flow channel (arrow) offset 50 cm/s. c The same plane acquired at VENC 130 cm/s showed true forward flow in black and the reverse flow channel at its left on the image. (provided by Dr. Sylvia Chen, Royal Brompton Hospital, London, UK)
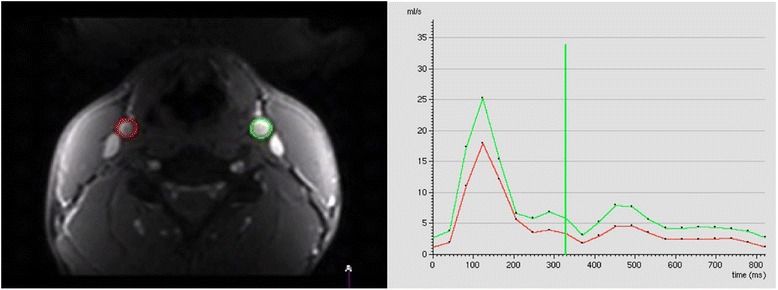
The left and right carotid arteries are outlined at each time frame on the phase or magnitude images using ROI’s (left). The instantaneous flow rate values, Q(t) are determined at each time frame. The flow rate from each time frame is plotted versus time in the cardiac cycle to yield flow curves (right)

Flow versus time in the cardiac cycle for an ROI in the ascending aorta of a patient with valvular regurgitation. The negative flow in diastole is due to antegrade flow from the regurgitation. Each point represents the integrated flow over the ROI at one time point

Development of vortical flow patterns in the thoracic aorta in a patient with a tubular shaped aortic arch and an aneurysm of the proximal descending aorta (yellow arrow, diameter = 4.2 cm). 3D streamlines within the 3D PC-MRA iso-surface illustrate accelerated flow along the outer aneurysm wall (t = 180 ms) and subsequent formation of a flow vortex (t = 300 ms and t = 380 ms). Note that aneurysm formation affects blood flow in the entire aorta resulting in marked helical flow in the ascending aorta (AAo, white arrows). From Ref. [107]
Aortic Stenosis. a Systolic frame from a balanced SSFP cine CMR acquisition in the left ventricular outflow tract plane shows a turbulent jet emanating from a thickened aortic valve suggesting significant stenosis. b Short axis view at the level of the aortic valve demonstrates a bicuspid valve en face with calcification of the anterior leaflet as well as at the commissural junctions. c Phase contrast image at mid-systole with VENC setting of 250 cm/s shows extensive aliasing, suggesting the peak velocity is considerably higher than 2.5 m/s.
d Repeat phase contrast acquisition at the same location and point in the cardiac cycle with VENC increased to 450 cm/s eliminates aliasing, allowing for accurate quantification of peak velocity across this stenotic valve. See also Additional file 1

Aortic Stenosis (continued). a Quantification of phase-contrast data across the stenotic aortic valve shown in Fig. 6 indicates severe stenosis, with peak velocity of 4 m/s. b Apical continuous-wave Doppler recording in the same patient underestimates stenosis severity (3 m/s) due to misalignment relative to the direction of stenotic flow. c Invasive hemodynamics confirmed severe stenosis, with simultaneous aortic (Ao) and left ventricular (LV) pressure measurement translating to an aortic valve area of 0.44 cm2/m2, with <0.5 cm2/m2 considered critical AS

Mitral Regurgitation. a Late post-gadolinium enhancement imaging in a patient with dyspnea demonstrates extensive infarct scar of the inferior and lateral walls (arrows). b Systolic frame from a three-chamber cine SSFP acquisition shows dephasing due to turbulent mitral regurgitation flow back into the left atrium. c In-plane velocity-encoded cine frame in systole also demonstrates the mitral regurgitation jet (arrow), but more clearly demonstrates its eccentric direction. The jet reaches back to the pulmonary vein ostia, consistent with severe insufficiency

Mitral Regurgitation (continued). Quantification of mitral regurgitant volume in the case shown in Fig. 8 was done by subtracting the forward stroke volume across the aortic valve by PC-CMR from the total LV stroke volume. LV stroke volume is computed by using any of a number commercially-available software packaged (Argus, Siemens shown) to delineate endocardial borders at end-systole and end-diastole in each of the contiguous short axis cine CMR planes covering the length of the LV. The difference in volumes computed using Simpson’s rule is the LV stroke volume. In this patient, the mitral regurgitant volume was 100 (LV stroke volume by cine CMR) – 45 (aortic stroke volume by PC-CMR) = 55 mL, or a regurgitant fraction of 55 % consistent with severe mitral regurgitation
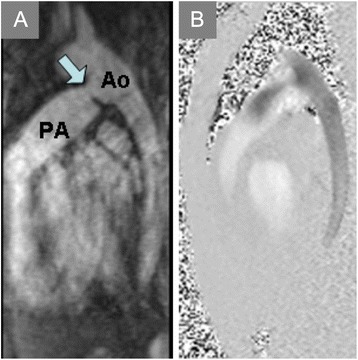
Patent Ductus Arteriosus. a Contrast-enhanced magnetic resonance angiogram in the sagittal plane demonstrates a patent ductus arteriosus (PDA, arrow) communicating between the proximal descending aorta (Ao) and pulmonary artery (PA). b
In-plane PC-CMR shows flow from the aorta into the PA via the PDA
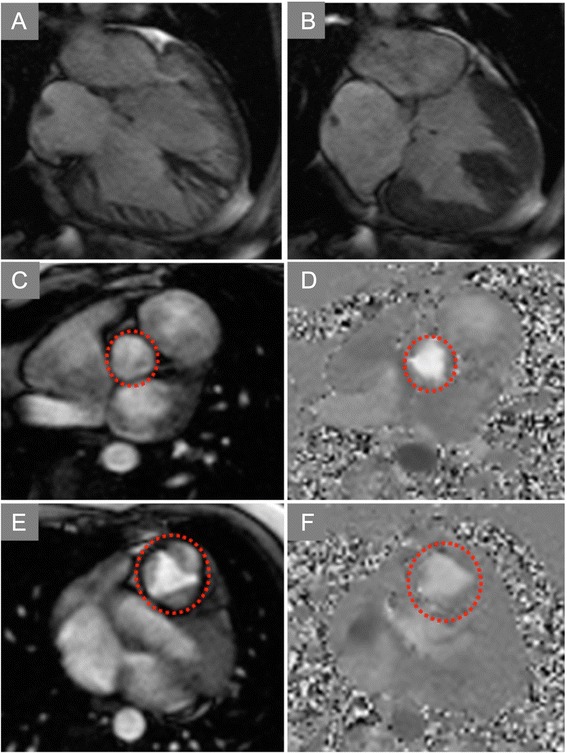
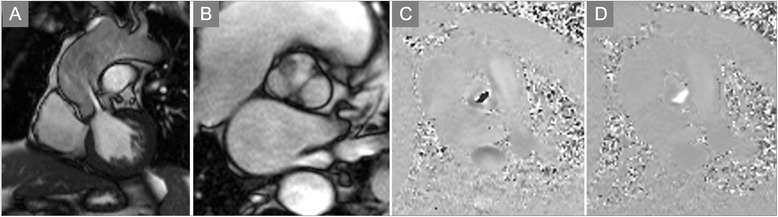
Ventricular Septal Defect. End-diastolic (a) and end-systolic (b) frames of a horizontal long-axis cine CMR acquisition demonstrate a large ventricular septal defect (VSD) of the basal half of the interventricular septum. In-plane PC-CMR showed no appreciable flow across this long-standing, restrictive VSD (Additional file 4). Through-plane PC-CMR with regions of interest (dotted circles) encircling the aortic valve
(c,d) and pulmonic valve (e,f) allowed calculation of Qp:Qs that yielded a value close to 1:1, consistent with Eisenmenger physiology or advanced pulmonary hypertension limiting flow across even a large defect
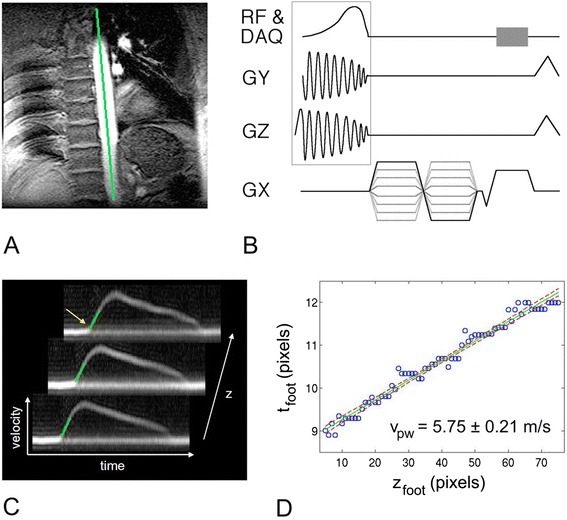
Fourier-velocity-encoded M-mode pulse sequence and pulse wave velocity data. a Scout image with position of M-mode pencil denoted as line. b ECG-gated M-mode pulse sequence, with pencil excitation (box) and Fourier velocity encoding is acquired typically over 64 heartbeats. c Three out of 256 velocity-vs-time waveforms generated along the length of the pencil. Green lines denote best fits to the foot of each waveform. The time of the foot (yellow arrow) is plotted against position in (d). The inverse slope of the best-fit line to the point yields the pulse wave velocity (provided by Dr. Chris Hardy, GE Global Research Center, Niskayuna, NY)
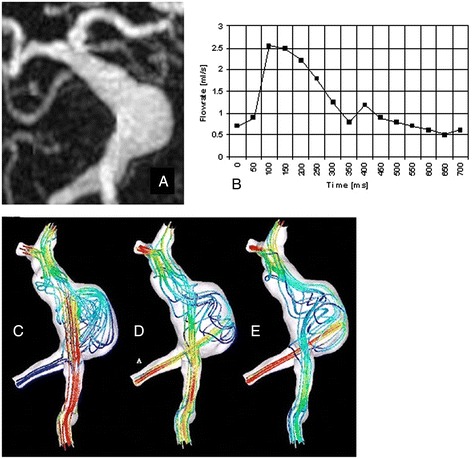
Giant fusiform basilar aneurysm: geometric and flow boundary conditions, and CFD predicted velocity fields for three different flow conditions. a Geometric boundaries as defined by Contrast-Enhanced MRA, b Flow boundary conditions from a slice transverse to a vertebral artery. c Velocity field with a high ratio of flow in the right vertebral artery relative to that in the left; d Velocity field with equal flow in each vertebral artery; and e Velocity field with a low ratio of flow in the right vertebral artery relative to that in the left
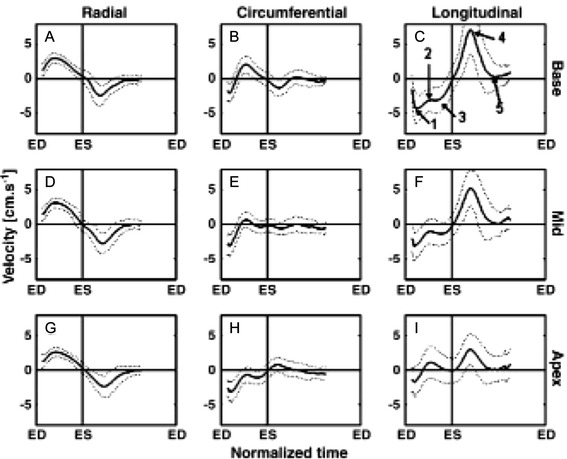
Myocardial velocity from 96 volunteers in radial, circumferential, and longitudinal directions at 3 short axis locations in the heart, normalized to the cardiac cycle length. (Reprinted with permission from Ref. [228])
References
-
- Hahn EL. Detection of Sea-Water Motion by Nuclear precession. J Geophys Res. 1965;65:776–777.
-
- Singer JR. NMR diffusion and flow measurements and an introduction to spin phase graphing. J Phys E. 1978;11:281–291.
-
- Moran PR. A flow velocity zeugmatographic interlace for NMR imaging in humans. Magn Reson Imaging. 1982;1:197–203. - PubMed
-
- Bryant DJ, Payne JA, Firmin DN, Longmore DB. Measurement of flow with NMR imaging using a gradient pulse and phase difference technique. J Comput Assist Tomogr. 1984;8:588–593. - PubMed
-
- Van Dijk P. Direct cardiac NMR imaging of heart wall and blood flow velocity. J Comput Assist Tomogr. 1984;8:429–436. - PubMed
Publication types
MeSH terms
LinkOut - more resources
Full Text Sources
Other Literature Sources
Medical
Miscellaneous
