. 2015 Dec;149(7):1932-1943.e9.
doi: 10.1053/j.gastro.2015.07.058. Epub 2015 Aug 7.

Signal Transducer and Activator of Transcription 3, Mediated Remodeling of the Tumor Microenvironment Results in Enhanced Tumor Drug Delivery in a Mouse Model of Pancreatic Cancer

Affiliations

Signal Transducer and Activator of Transcription 3, Mediated Remodeling of the Tumor Microenvironment Results in Enhanced Tumor Drug Delivery in a Mouse Model of Pancreatic Cancer

Nagaraj S Nagathihalli et al. Gastroenterology. 2015 Dec.

Abstract

Background & aims: A hallmark of pancreatic ductal adenocarcinoma (PDAC) is the presence of a dense desmoplastic reaction (stroma) that impedes drug delivery to the tumor. Attempts to deplete the tumor stroma have resulted in formation of more aggressive tumors. We have identified signal transducer and activator of transcription (STAT) 3 as a biomarker of resistance to cytotoxic and molecularly targeted therapy in PDAC. The purpose of this study is to investigate the effects of targeting STAT3 on the PDAC stroma and on therapeutic resistance.

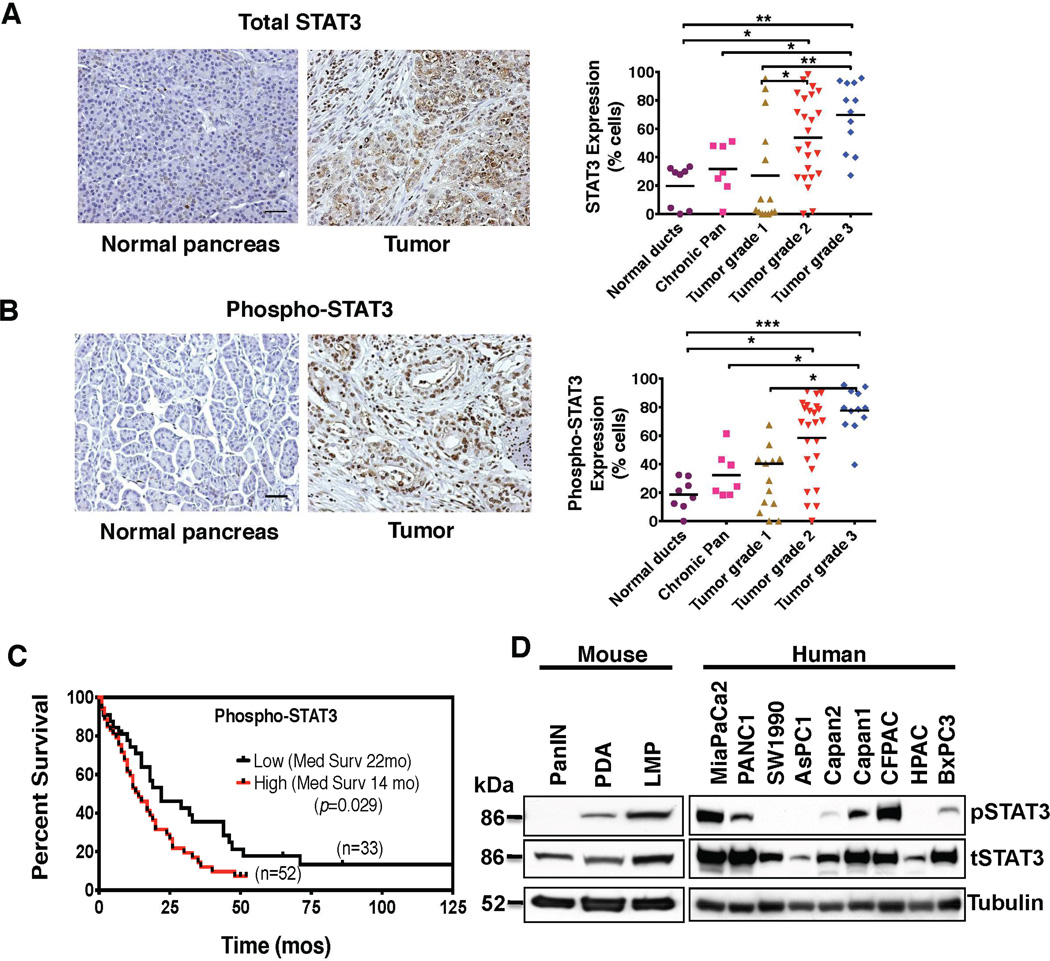
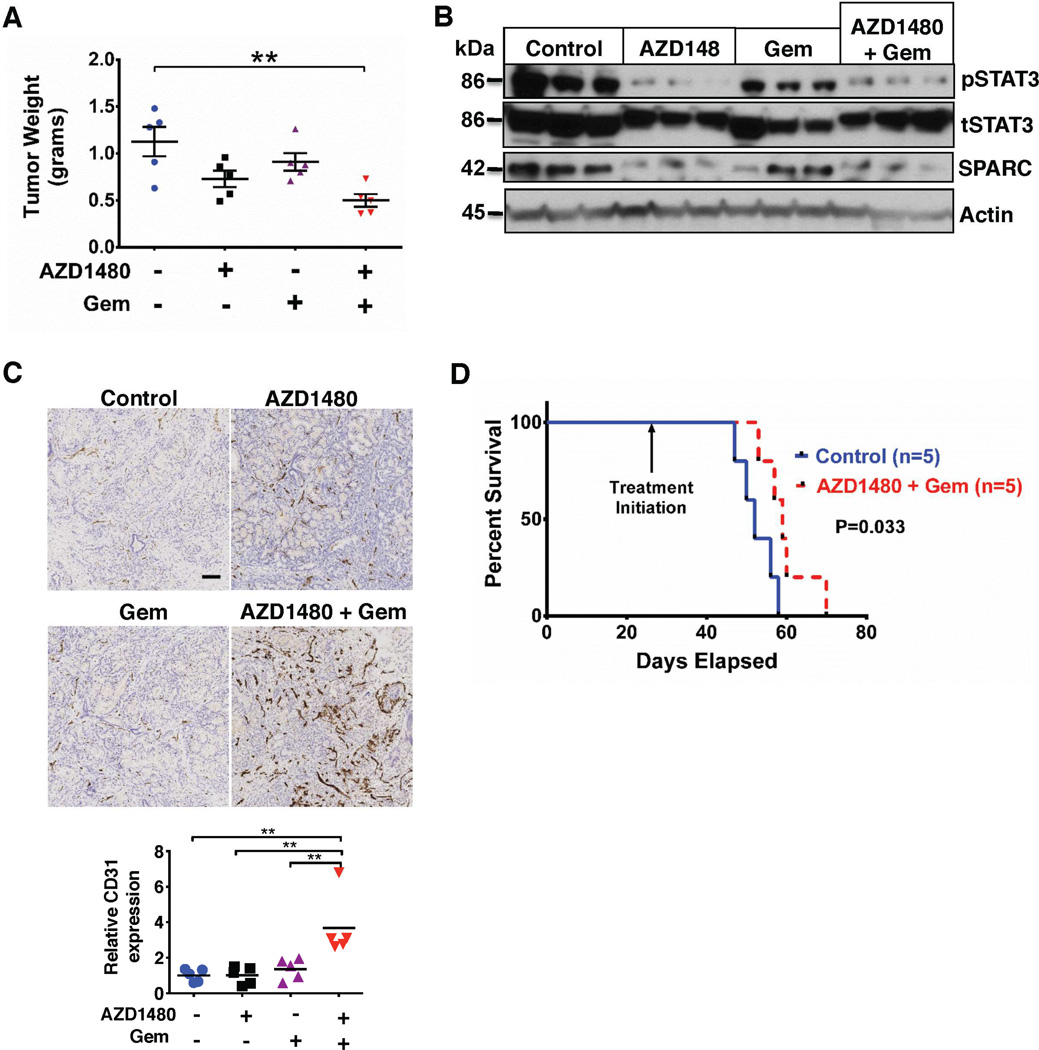
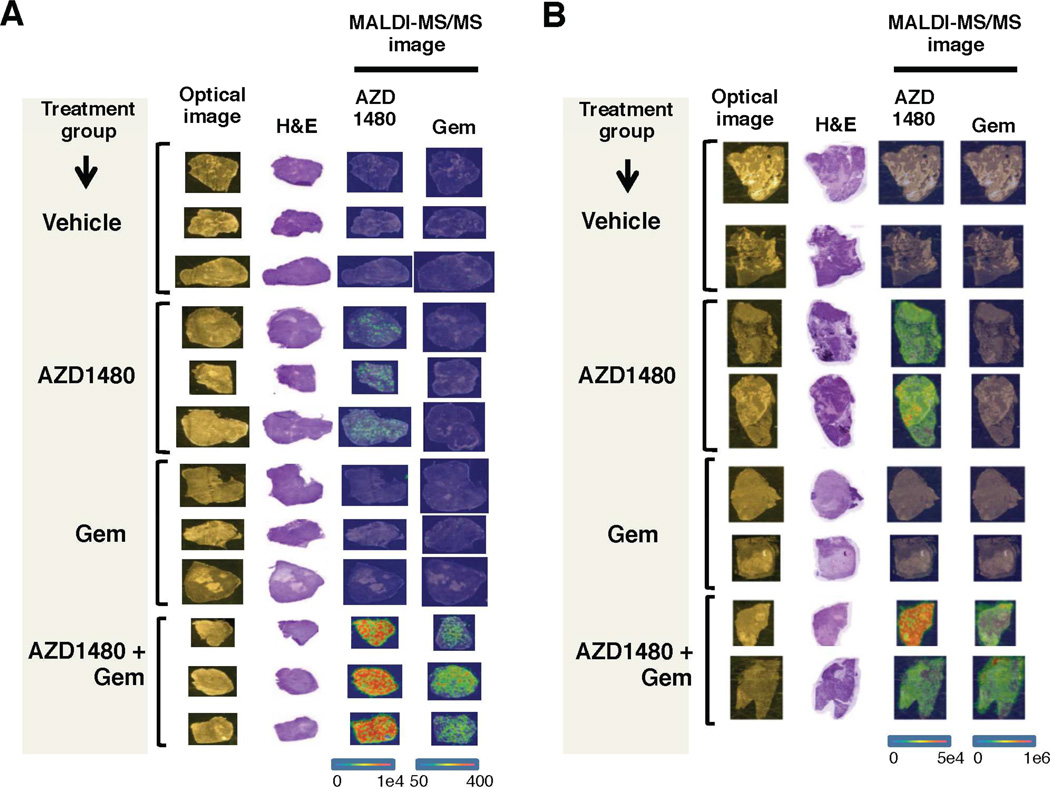
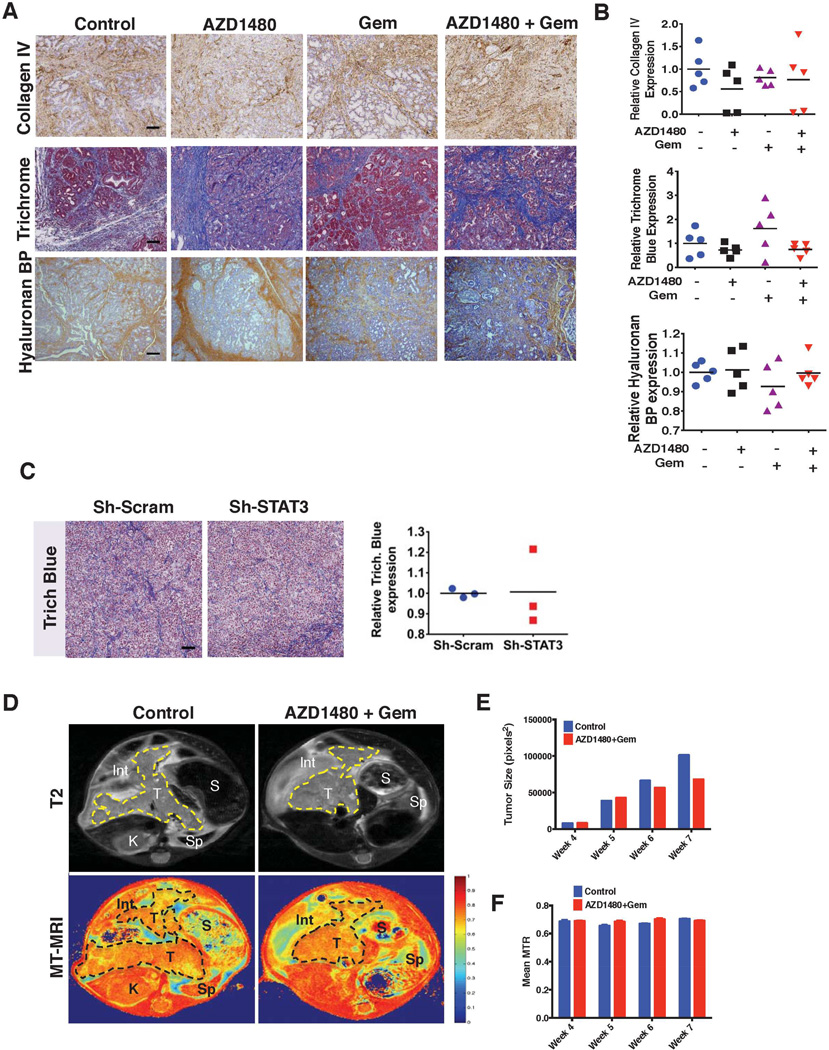
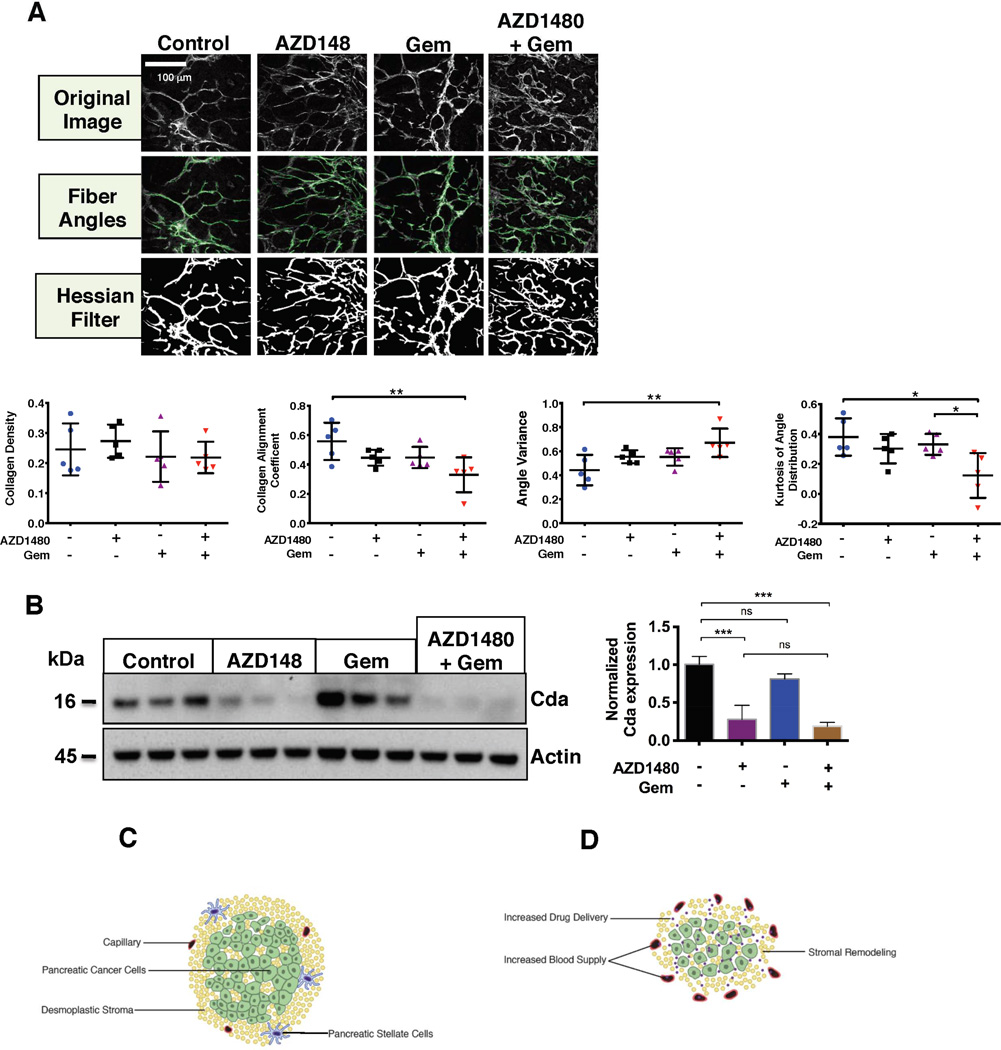
Methods: Activated STAT3 protein expression was determined in human pancreatic tissues and tumor cell lines. In vivo effects of AZD1480, a JAK/STAT3 inhibitor, gemcitabine or the combination were determined in Ptf1a(cre/+);LSL-Kras(G12D/+);Tgfbr2(flox/flox) (PKT) mice and in orthotopic tumor xenografts. Drug delivery was analyzed by matrix-assisted laser desorption/ionization imaging mass spectrometry. Collagen second harmonic generation imaging quantified tumor collagen alignment and density.

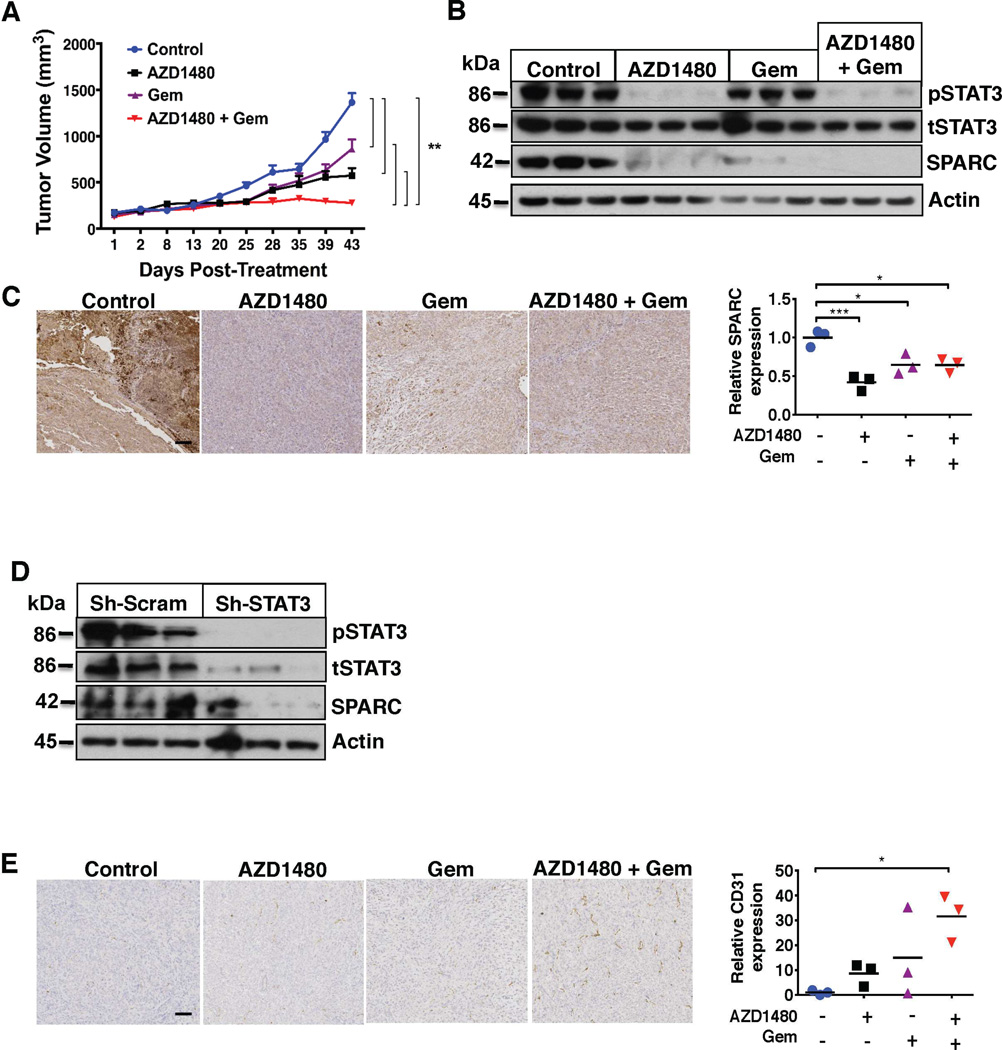
Results: STAT3 activation correlates with decreased survival and advanced tumor stage in patients with PDAC. STAT3 inhibition combined with gemcitabine significantly inhibits tumor growth in both an orthotopic and the PKT mouse model of PDAC. This combined therapy attenuates in vivo expression of SPARC, increases microvessel density, and enhances drug delivery to the tumor without depletion of stromal collagen or hyaluronan. Instead, the PDAC tumors demonstrate vascular normalization, remodeling of the tumor stroma, and down-regulation of cytidine deaminase.

Conclusions: Targeted inhibition of STAT3 combined with gemcitabine enhances in vivo drug delivery and therapeutic response in PDAC. These effects occur through tumor stromal remodeling and down-regulation of cytidine deaminase without depletion of tumor stromal content.

Keywords: Drug Delivery; Pancreatic Cancer; Stroma; Tumor Microenvironment.


Conflict of interest statement

Conflict of Interest: The authors declare no conflicts of interest.

Figures

Figure 1
Figure 1
STAT3 expression is associated with chemoresistance and overall survival in PDAC patients. (A) and (B) Representative tissue sections from a TMA constructed from patient samples are shown (left panels). The tissues were grouped by diagnosis and grade, and percentage of cells positively stained for total STAT3 are shown (scale bar = 0.5 mm). (A) Total and (B) pSTAT3 expression increased in a step-wise fashion from normal pancreas to chronic pancreatitis and through advancing grades of PDAC (right panels). (C) Kaplan-Meier survival curve comparing overall survival for patients with PDAC stratified by level of pSTAT3 staining. Patients with high pSTAT3 expression have significantly decreased overall survival compared with patients with low pSTAT3 expression. (D) Expression of pSTAT3 and total STAT3 in pancreatic cell lines generated from PanIN, primary PDAC (PDA) and liver metastatic (LMP) lesions from KC (PanIN) and KPC (PDA and LMP) mice (left panel), and in human PDAC cell lines (right panel) are demonstrated. Abbreviations: tSTAT3 – total-STAT3; pSTAT3 – phospho-STAT3; * – P < 0.05; ** – P < 0.01; *** – P < 0.001.
Figure 2
Figure 2
Combined AZD1480 and gemcitabine treatment decreases tumor growth and alters the tumor microenvironment in PDAC xenograft models. (A) AZD1480 with gemcitabine (Gem) induces in vivo tumor regression. Growth rate of PANC1 flank xenografts in Fox1-nu/nu mice treated with vehicle, AZD1480, Gem, or AZD1480/Gem treatment. Error bars indicate SD of mean; n = 5 per group. ** – P < 0.01. (B) Orthotopic pancreatic injections of luciferase tagged PANC1 cells were treated with vehicle, AZD1480, Gem, or AZD1480/Gem treatment. Tumor xenograft tissues (n=3) were analyzed for total STAT3, pSTAT3 and SPARC expression by immunoblot analysis. AZD1480/Gem treatment significantly inhibits expression of pSTAT3 and SPARC. (C) Immunohistochemistry of orthotopic pancreatic tumor xenograft tissues show decreased SPARC expression with AZD1480 and AZD1480/Gem treatment. Left panels show representative examples of tumor tissues stained with SPARC (scale bar= 0.5 mm) and the quantified graph in the right panel. * – p < 0.05; *** – P < 0.001. (D) Analysis of tumor lysates of orthotopic pancreas injections of Sh-scrambled and Sh-STAT3 PANC1 cells show that Sh-STAT3 PANC1 tumors have significantly decreased expression of pSTAT3 and SPARC (E) Orthotopic pancreatic tumor xenograft tissues were stained with CD31 antibody to measure microvessel density. Left panels show representative examples of tumor tissues stained with CD31 (scale bar=0.5 mm) and the quantified graph in the right panel. CD31 staining showed markedly increased microvessel density with AZD1480/Gem combined therapy. * – p < 0.05.
Figure 3
Figure 3
Combined AZD1480 and gemcitabine treatment alters the tumor microenvironment and improves survival of PKT mice. (A) PKT mice were treated with vehicle, AZD1480, Gem, or combined AZD1480/Gem. Tumor weight in the AZD1480/Gem treated mice was significantly decreased compared with vehicle treated controls. ** – P < 0.01. (B) Western blot analysis of whole tumor lysates from PKT mice demonstrated decreased expression of pSTAT3 and SPARC in mice treated with AZD1480 or AZD1480/Gem compared with vehicle control mice. (C) Microvessel density (assessed by staining for CD31) was significantly increased with AZD1480/Gem treatment. Upper panels show representative examples of tumor tissues stained with CD31 (scale bar=0.5 mm) and the quantified graph is shown in the lower panel. ** – P < 0.01. (D) Kaplan-Meier survival analysis shows significantly improved overall survival with AZD1480/Gem (median 60 days) compared with vehicle control (median 52 days, log rank test, p = 0.033).
Figure 4
Figure 4
AZD1480 and gemcitabine treatment enhances tumor drug delivery. MALDI-MS/MS analysis of pancreatic tumor xenograft tissues was conducted to detect the presence of AZD1480 and Gem within the tumor. The optical image column demonstrates tissues prior to matrix coating; the H&E column contains stained serial sections. The MALDI-MS/MS images are divided into two columns, the first demonstrating detection of AZD1480 (m/z 255 and 257) and the second demonstrating detection of Gem (m/z 112). (A) MS images of the localization of AZD1480 and Gem in subcutaneous xenograft tissue sections. (B) MS images of the localization of AZD1480 and Gem in orthotopic xenograft tissue sections. The combination of AZD1480 and Gem results in enhanced in vivo delivery of both drugs in pancreatic tumor xenografts. The color scale ranges from blue to red, with red representing high concentration and blue representing low concentration of drug detected.
Figure 5
Figure 5
AZD1480 and gemcitabine treatment does not alter stromal density. (A) Tumors from PKT mice treated with vehicle, AZD1480, Gem, or AZD1480/Gem were stained for collagen IV, trichrome Blue, and hyaluronan binding protein (BP) (Scale bars=0.5 mm). (B) Quantitative analysis of collagen IV, trichrome blue, and hyaluronan BP revealed no significant difference in collagen or hyaluronan density after any treatment. (C) Stromal effects of STAT3 knock down (Sh-STAT3). Sh-Scram and Sh-STAT3 PANC1 cells were injected into the flanks of Fox1-nu/nu mice and harvested when mice were euthanized. Trichrome blue stain was performed and collagen density was calculated by quantifying collagen staining and shows now difference between the two groups. (D) Magnetization Transfer (MT)-MRI was utilized to follow the longitudinal effects of combined AZD1480/Gem treatment on stromal fibrosis. Representative T2-MRI and MT-MRI images of 7-week-old PKT mice are shown. A region of interest (ROI) circumscribing the pancreas was determined for each axial slice, and tumor size (E) and mean magnetization transfer ratio (MTR) (F) were calculated at each time point. ROI’s (yellow dashed line in T2 axial images, top panels, and a black dashed line MT axial images, bottom panels) show a clear decrease in tumor volume with AZD1480/Gem treatment, but no effect on MTR. Int – intestine; K – kidney; S – stomach; Sp – spleen; T – tumor.
Figure 6
Figure 6
AZD1480 and gemcitabine treatment remodels the tumor stroma. (A) Collagen second harmonic generation (SHG) imaging was performed on tumor tissue collected from PKT mice treated with vehicle, AZD1480, Gem, or AZD1480/Gem. Upper panels show representative images from each treatment group for fiber angles and hessian filter. In the lower panels, graphs show significantly increased angle variance and significantly decreased collagen alignment coefficient and kurtosis of angle distribution with AZD1480/Gem treatment. Collagen density was unchanged between treatment groups. * – P < 0.05; ** – P < 0.01. (B) Tumor lysates from PKT mice were analyzed for Cytidine deaminase (Cda) expression revealing significantly decreased expression of Cda with AZD1480 or AZD1480/Gem treatment (left panel). Quantitative analysis by densitometry of Cda expression is shown on the right. ns – non significant ; *** – P < 0.001. (C) PDAC is characterized by dense stroma and poor vascularity. PSCs secrete IL-6, leading to STAT3 activation and enhanced tumorigenicity in PDAC cells. (D) Combined STAT3 inhibition and gemcitabine treatment results in enhanced drug delivery, increased microvessel density, and stromal remodeling.

Comment in

References

    1. Jemal A, Siegel R, Ward E, et al. Cancer statistics, 2008. CA Cancer J Clin. 2008;58:71–96. - PubMed
    1. Olson P, Chu GC, Perry SR, et al. Imaging guided trials of the angiogenesis inhibitor sunitinib in mouse models predict efficacy in pancreatic neuroendocrine but not ductal carcinoma. Proc Natl Acad Sci U S A. 2011;108:E1275–E1284. - PMC - PubMed
    1. Komar G, Kauhanen S, Liukko K, et al. Decreased blood flow with increased metabolic activity: a novel sign of pancreatic tumor aggressiveness. Clin Cancer Res. 2009;15:5511–5517. - PubMed
    1. Algül H, Treiber M, Lesina M, et al. Mechanisms of disease: chronic inflammation and cancer in the pancreas--a potential role for pancreatic stellate cells? Nat Clin Pract Gastroenterol Hepatol. 2007;4:454–462. - PubMed
    1. Maity A, Bernhard EJ. Modulating tumor vasculature through signaling inhibition to improve cytotoxic therapy. Cancer Res. 2010;70:2141–2145. - PMC - PubMed

MeSH terms