. 2015 Dec;14(6):971-81.
doi: 10.1111/acel.12379. Epub 2015 Aug 8.

Atypical antidepressants extend lifespan of Caenorhabditis elegans by activation of a non-cell-autonomous stress response

Affiliations

Atypical antidepressants extend lifespan of Caenorhabditis elegans by activation of a non-cell-autonomous stress response

Sunitha Rangaraju et al. Aging Cell. 2015 Dec.

Abstract

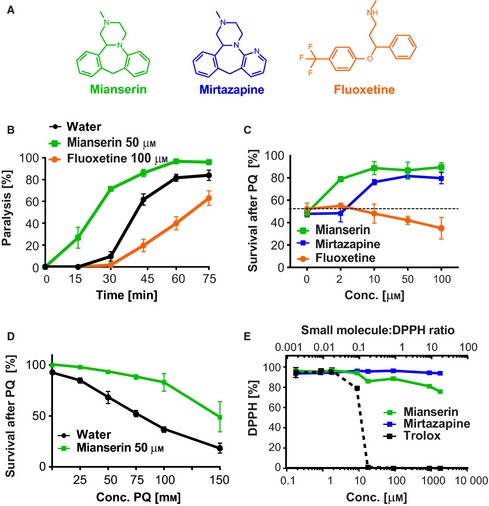
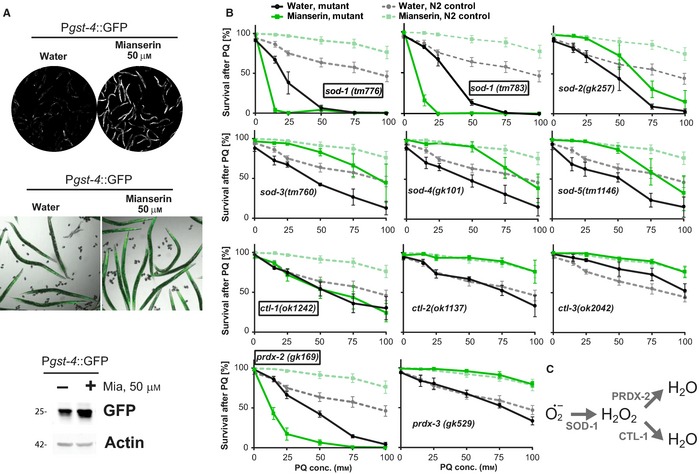
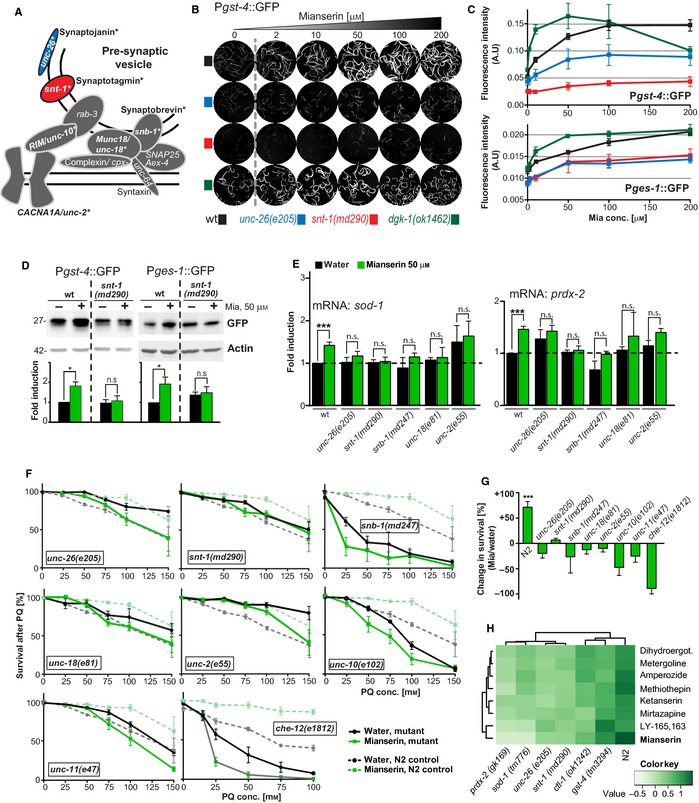
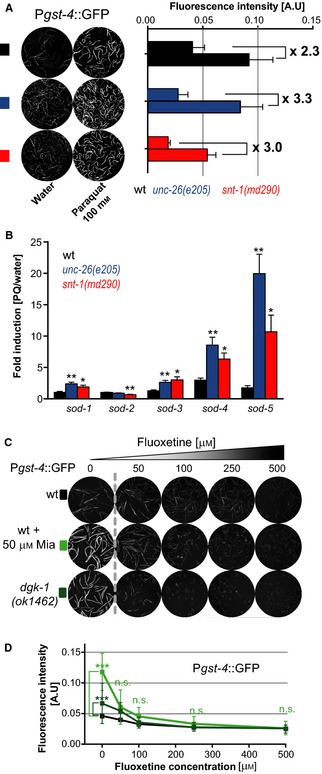
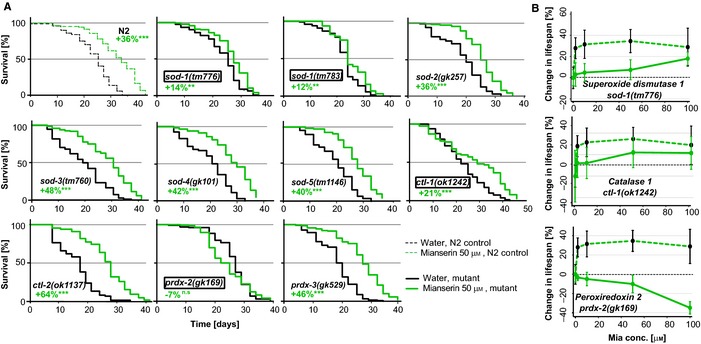
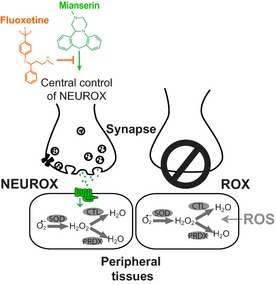
Oxidative stress has long been associated with aging and has recently been linked to psychiatric disorders, including psychosis and depression. We identified multiple antipsychotics and antidepressants that extend Caenorhabditis elegans lifespan and protect the animal from oxidative stress. Here, we report that atypical antidepressants activate a neuronal mechanism that regulates the response to oxidative stress throughout the animal. While the activation of the oxidative stress response by atypical antidepressants depends on synaptic transmission, the activation by reactive oxygen species does not. Lifespan extension by atypical antidepressants depends on the neuronal oxidative stress response activation mechanism. Neuronal regulation of the oxidative stress response is likely to have evolved as a survival mechanism to protect the organism from oxidative stress, upon detection of adverse or dangerous conditions by the nervous system.

Keywords: Caenorhabditis elegans; anti-aging; antidepressant; non-cell-autonomous; psychiatric disease; signal transduction; stress; synaptic transmission.


Figures

Figure 1
Figure 1
The atypical antidepressant Mianserin increases synaptic transmission and resistance to oxidative stress. (A) Structures of the atypical antidepressants Mianserin and Mirtazapine and the typical antidepressant Fluoxetine. (B) Mianserin increases and Fluoxetine decreases synaptic transmission as measured by aldicarb‐induced paralysis. Wild‐type L4‐stage animals were pretreated with 50 μm Mianserin or 100 μm Fluoxetine for 2 h, followed by 4 mm of the acetylcholine esterase inhibitor aldicarb. Aldicarb‐induced paralysis, a measure of synaptic transmission, was determined every 15 min and plotted in [%] (y‐axis) as a function of time in minutes [min] (x‐axis). (C) Antidepressant treatment affects the survival of Caenorhabditis elegans under conditions of oxidative stress. Wild‐type day 1 adults were treated with increasing concentrations of the indicated antidepressants, followed by 100 mm of the ROS generator paraquat on day 5. Survival of animals was determined 24 h later and plotted in [%] (y‐axis) as a function of antidepressant concentration [μm] (x‐axis). Dotted line shows the survival of untreated animals. (D) Mianserin treatment protects C. elegans from a range of paraquat concentrations. Wild‐type day 1 adults were treated with water or 50 μm Mianserin, followed by increasing concentrations of paraquat on day 5. Survival of animals was determined 24 h later and plotted in [%] (y‐axis) as a function of paraquat concentration [mm] ((x‐axis). (E) Antidepressants have no significant free radical‐scavenging activity. Increasing concentrations of either the indicated antidepressants or the ROS scavenger Trolox were incubated with 90 μm of the free radical DPPH. Reduction of DPPH [%] was monitored by measuring absorption at 520 nm (y‐axis) and plotted as the ratio of small molecule to DPPH (upper x‐axis) or the concentration of small molecule in μm (lower x‐axis). All error bars show SEM. for multiple, independent experiments. For additional data, see Fig. S1 (Supporting information). For detailed statistics, see Tables S1–S3 (Supporting information).
Figure 2
Figure 2
Mianserin activates a protective oxidative stress response. (A) Mianserin induces expression of the Pgst‐4::GFP reporter. Images show GFP fluorescence of water‐ or Mianserin‐treated (50 μm) reporter animals after 24‐h treatment. Images were taken using identical exposure settings (upper panel). Merged image of bright‐field and GFP fluorescence is shown (middle panel). Localization of GFP in water‐treated worms and induced GFP in Mianserin‐treated worms can be visualized. Verification of Pgst‐4::GFP induction by immunoblotting on day 5 (lower panel). Immunoblot of water‐ or Mianserin‐treated (50 μm) Pgst‐4::GFP worm lysates, probed with GFP or actin (loading control) antibodies. (B) Mianserin‐induced protection from oxidative stress requires specific oxidative stress response genes. Wild‐type or mutant day 1 adults were treated with water or 50 μm Mianserin, followed by increasing concentrations of paraquat on day 5. Survival of animals was determined 24 h later and plotted in [%] (y‐axis) as a function of paraquat concentration [mm] (x‐axis). Parallel wild‐type (N2) control experiments (dotted lines) are shown for each graph. Genotypes (indicated in each graph) for which Mianserin failed to increase resistance to oxidative stress are boxed. (C) Mianserin‐induced superoxide detoxification pathway. Superoxides (O2*) are converted to H2O2 by SOD‐1, followed by a conversion to water by PRDX‐2 and CTL‐1. All error bars show S.E.M. for 3 or more independent experiments. For additional data, see Figures S2 and S3 (Supporting information). For detailed statistics, see Table S3 (Supporting information).
Figure 3
Figure 3
Mianserin‐mediated activation of the oxidative stress response is dependent on synaptic transmission and chemosensation. (A) Cartoon of a presynaptic vesicle compartment and physical localization of synaptic components. Synaptic components are labeled using mammalian as well as Caenorhabditis elegans nomenclature. Synaptic components tested in this study, namely unc‐26, snt‐1, snb‐1, unc‐18, unc‐2, and unc‐10, are highlighted in bold and marked with asterisks. Synaptojanin (UNC‐26, blue) and synaptotagmin (SNT‐1, red) are color‐coded. (B) Mianserin induces expression of the Pgst‐4:: GFP reporter via synaptic transmission. Images show GFP fluorescence of reporter animals. Day 1 adult wild‐type or synaptic mutant Pgst‐4:: GFP reporter animals were treated with increasing concentrations of Mianserin and fluorescent images were taken 24 h later. Reduced synaptic transmission (unc‐26(e205) or snt‐1(md290)) reduces the induction of the Pgst‐4:: GFP reporter by Mianserin. Enhanced synaptic transmission (dgk‐1(ok1462)) (dark green) enhances the induction of the Pgst‐4:: GFP reporter by Mianserin. (C) Quantification of Mianserin‐induced fluorescence of strains carrying Pgst‐4:: GFP (upper panel) and Pges‐1:: GFP reporters (lower panel). Images are not shown for ges‐1:: GFP. Fluorescent intensity arbitrary units [A.U.] (y‐axis) is plotted as a function of Mianserin concentration [μm] (x‐axis). (D) Immunoblot verification of Pgst‐4::GFP induction by Mianserin on day 5 in wild‐type or snt‐1(md290) strains carrying the Pgst‐4:: GFP or Pges‐1::GFP reporter. Animals were treated with water or Mianserin (50 μm) on day 1 and harvested on day 5, followed by lysate preparation and probing with GFP or actin (loading control) antibodies. (E) Mianserin fails to induce transcription of sod‐1 and prdx‐2 in animals with impaired synaptic transmission. Wild‐type (N2) or mutant day 1 adults were treated with water or 50 μm Mianserin, and RNA was harvested on day 5. Gene expression levels were measured by qRT‐PCR and plotted as fold induction (y‐axis) over transcript levels of untreated, wild‐type animals. (F) Mianserin‐induced protection from oxidative stress requires synaptic transmission and chemosensory neuron function. Wild‐type or mutant day 1 adults were treated with water or 50 μm Mianserin, followed by increasing concentrations of paraquat on day 5. Survival of animals was determined 24 h later and plotted in [%] (y‐axis) as a function of paraquat concentration [mm] (x‐axis). Parallel wild‐type (N2) control experiments (dotted lines) are shown for each graph. Genotypes (indicated in each graph) for which Mianserin failed to increase resistance to oxidative stress are boxed. (G) Percent change in survival of Mianserin‐treated compared to water‐treated animals after 24‐h PQ treatment (100 mm). Y‐axis shows fold change in survival [%] (Mianserin/water). (H) Hierarchical clustering of fold change in paraquat protection of wt and mutant animals shows the degree of similarity between genotypes (top) or eight structurally distinct serotonin antagonists (left). (Dihydroergot stands for dihydroergotamine.) All error bars show SEM of 3–11 independent experiments. For detailed statistics, see Tables S4 and S5 (Supporting information). ***P < 0.001, n.s.: not significant, P > 0.05.
Figure 4
Figure 4
Reactive oxygen species‐mediated activation of the oxidative stress response is independent of synaptic transmission. (A) The ROS generator paraquat induces expression of the Pgst‐4:: GFP reporter independent of synaptic transmission. Images show GFP fluorescence of Pgst‐4::GFP reporter animals. Left panel: Wild‐type or synaptic mutant Pgst‐4:: GFP reporter strains (unc‐26(e205), snt‐1(md290)) were treated with water or 100 mm paraquat on day 1 and imaged 8 h later. Right panel: Bar graphs show quantification of fluorescent intensity [A.U.] for wild‐type or synaptic mutants. Fluorescent intensity arbitrary units [A.U.] (y‐axis) for water‐ and paraquat‐treated samples is indicated for each strain. (B) Paraquat induces transcription of sod genes in wild‐type (N2) and synaptic mutant animals. Eight hours after treating day 1 adult wild‐type or mutant animals with water or 100 mm paraquat, RNA was harvested. mRNA levels of sod genes were evaluated by qRT‐PCR and plotted as fold induction (PQ/water) (y‐axis) for each sod gene. (C) Fluoxetine represses expression of the Pgst‐4:: GFP. Images show GFP fluorescence of Pgst‐4:: GFP reporter animals treated with increasing concentrations of Fluoxetine alone, or in combination with 50 μm Mianserin, on day 1 of adulthood. Images were captured 24 h after treatment. (D) Quantification of (C) Fluoxetine‐induced repression of Pgst‐4:: GFP. Fluorescent intensity [A.U.] (y‐axis) is plotted as a function of Fluoxetine concentration [μm] (x‐axis). All error bars show SEM of 3–6 independent experiments. For detailed statistics, see Table S6 (Supporting information). *P<0.05, **P<0.01, ***P<0.001, n.s., not significant P>0.05.
Figure 5
Figure 5
Lifespan extension and protection from oxidative stress by Mianserin require similar genes. (A) Mianserin partially requires sod‐1 and ctl‐1 and completely requires prdx‐2, but does not require sod‐2, sod‐3, sod‐4, sod‐5, ctl‐2, ctl‐3, and prdx‐6 for lifespan extension. N2 animals (dotted lines) and animals carrying deletion mutations in redox genes (solid lines), namely sod‐1(tm776), sod‐1(tm783), sod‐2(gk257), sod‐3(tm760), sod‐4(gk101), sod‐5(tm1146), ctl‐1(ok1242), ctl‐2(ok1137), ctl‐3(ok2042), prdx‐2 (gk169), and prdx‐3(gk529), were treated with water (black) or 50 μm Mianserin (green) on day 1, and their lifespans were assessed. Graphs show fraction of animals alive [%] (y‐axis) as a function of time [days] (x‐axis). See Table S9 for statistics of all lifespan trials. (B) Lifespan extension by Mianserin is reduced or abolished in mutants with an impaired oxidative stress response. Graph shows mean increase in lifespan [%] (y‐axis) as a function of Mianserin concentration [μm] (x‐axis). Dotted green lines represent Mianserin‐treated wild‐type (N2) animals, and solid green lines represent animals carrying mutations in oxidative stress response genes required for NEUROX. Genotype for each strain is indicated in each graph. All error bars show standard deviation for one experiment. The response of each mutant was tested in at least one additional experiment. For detailed statistics, see Table S7 (Supporting information).
Figure 6
Figure 6
Neuronal versus cell‐autonomous activation of the oxidative stress response. Left synapse: The neuronal regulation of the oxidative stress response (NEUROX) directly or indirectly regulates transcription of oxidative stress response genes via neuronal synaptic transmission. NEUROX is differentially modulated by different antidepressants, with Mianserin activating and Fluoxetine inhibiting the oxidative stress response. Right synapse: In animals with impaired synaptic transmission, the neuronal control of the oxidative stress response is lost and reactive oxygen species activate the oxidative stress response cell autonomously (ROX).

References

    1. Abdel‐Wahab BA, Salama RH (2011) Venlafaxine protects against stress‐induced oxidative DNA damage in hippocampus during antidepressant testing in mice. Pharmacol. Biochem. Behav. 100, 59–65. - PubMed
    1. Bansal A, Zhu LJ, Yen K, Tissenbaum HA (2015) Uncoupling lifespan and healthspan in Caenorhabditis elegans longevity mutants. Proc. Natl Acad. Sci. U. S. A. 112, E277–E286. - PMC - PubMed
    1. Barclay JW, Morgan A, Burgoyne RD (2012) Neurotransmitter release mechanisms studied in Caenorhabditis elegans . Cell Calcium 52, 289–295. - PubMed
    1. Bargmann CI (2012) Beyond the connectome: how neuromodulators shape neural circuits. BioEssays 34, 458–465. - PubMed
    1. Benedetti C, Haynes CM, Yang Y, Harding HP, Ron D (2006) Ubiquitin‐like protein 5 positively regulates chaperone gene expression in the mitochondrial unfolded protein response. Genetics 174, 229–239. - PMC - PubMed

Publication types

MeSH terms