. 2015 Aug 24;34(4):387-99.
doi: 10.1016/j.devcel.2015.06.017. Epub 2015 Aug 6.

Nerves Regulate Cardiomyocyte Proliferation and Heart Regeneration

Affiliations

Nerves Regulate Cardiomyocyte Proliferation and Heart Regeneration

Ahmed I Mahmoud et al. Dev Cell. .

Abstract

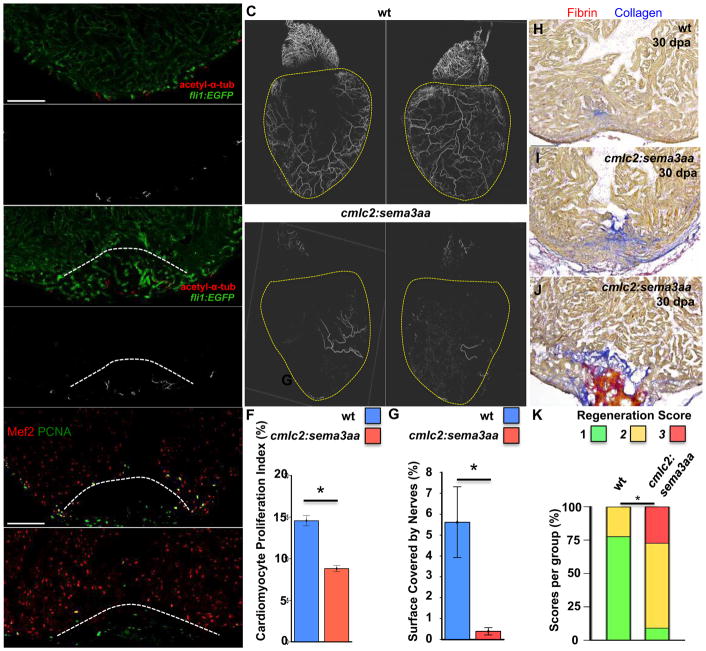
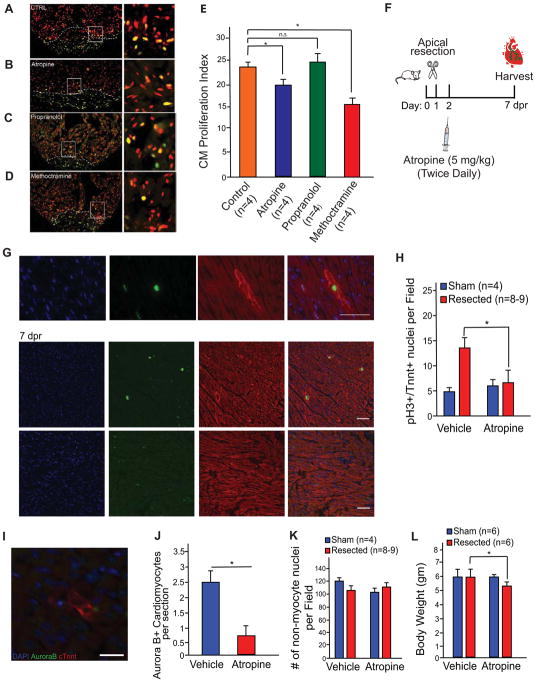
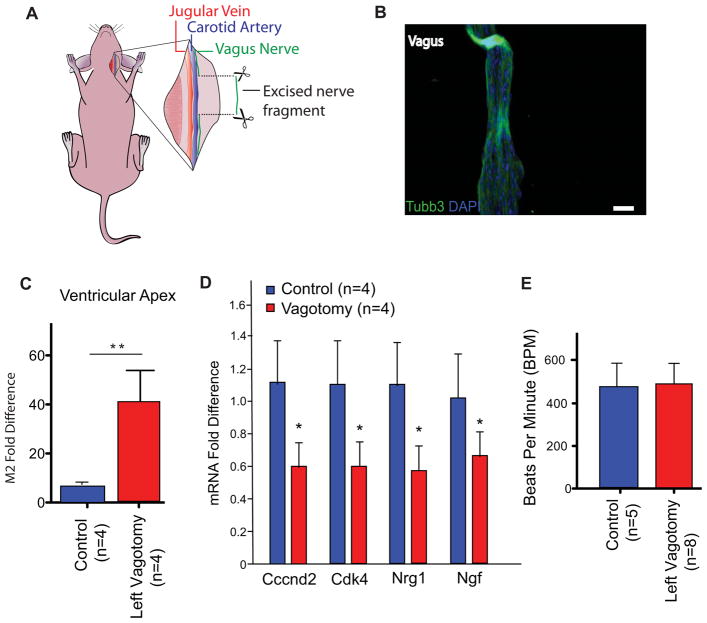
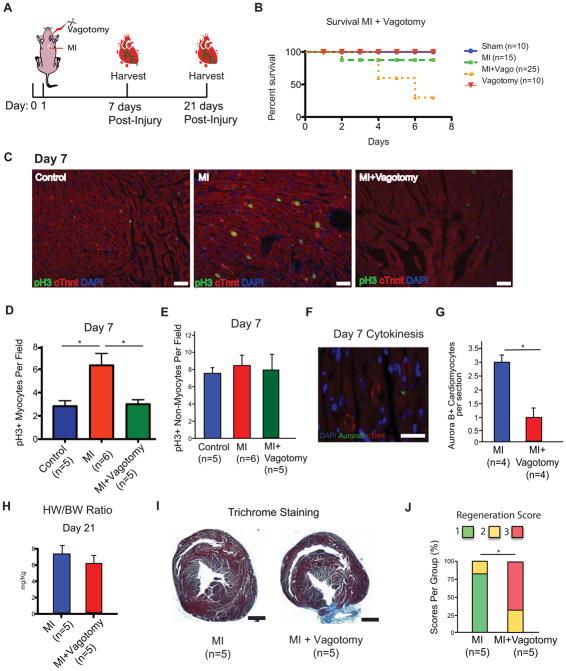
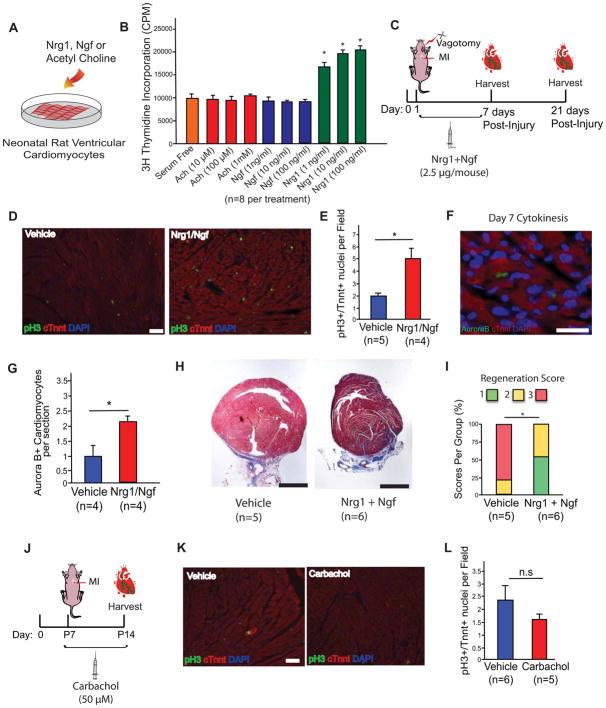
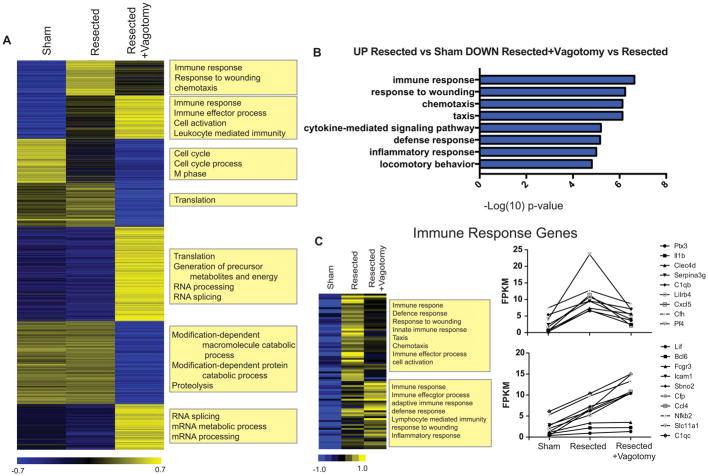
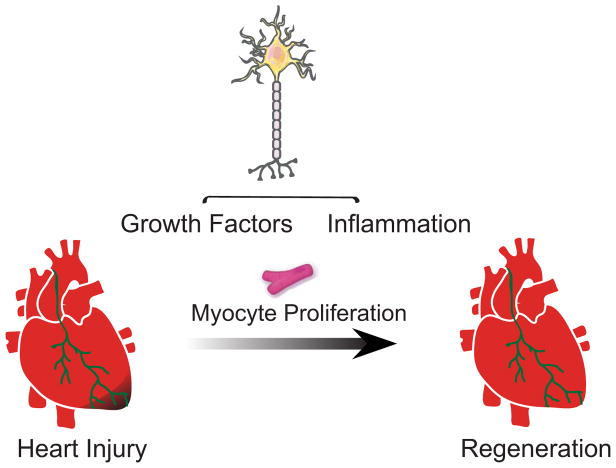
Some organisms, such as adult zebrafish and newborn mice, have the capacity to regenerate heart tissue following injury. Unraveling the mechanisms of heart regeneration is fundamental to understanding why regeneration fails in adult humans. Numerous studies have revealed that nerves are crucial for organ regeneration, thus we aimed to determine whether nerves guide heart regeneration. Here, we show using transgenic zebrafish that inhibition of cardiac innervation leads to reduction of myocyte proliferation following injury. Specifically, pharmacological inhibition of cholinergic nerve function reduces cardiomyocyte proliferation in the injured hearts of both zebrafish and neonatal mice. Direct mechanical denervation impairs heart regeneration in neonatal mice, which was rescued by the administration of neuregulin 1 (NRG1) and nerve growth factor (NGF) recombinant proteins. Transcriptional analysis of mechanically denervated hearts revealed a blunted inflammatory and immune response following injury. These findings demonstrate that nerve function is required for both zebrafish and mouse heart regeneration.


Figures

Figure 1
Figure 1. Effects of Cardiac Innervation on Injury-Induced Cardiomyocyte Proliferation
A and B) Section images of uninjured (A) and regenerated (30 dpa; (B)) ventricular apices visualized for endothelial cells (green) and nerves (red). The approximate regenerated area is indicated by a dashed line. Grayscale images indicating nerves, positive for acetylated alpha-tubulin, are shown in (A′) and (B′). Scale bar represents 100 μm. C) Whole mount images of hearts from wild-type (wt; left) and cmlc2:sema3aa (right) animals, immunostained for acetylated alpha-tubulin to indicate cardiac nerves, which are reduced by sema3aa overexpression. Scale bar represents 100 μm. D and E) Section images of 7 dpa ventricular apices of wild-type (D) or cmlc2:sema3aa (E) animals, stained for Mef2+PCNA+ cells. Wounds are indicated by dashed lines. Scale bar represents 100 μm. F) Quantification of cardiomyocyte proliferation at 7 dpa from hypo- (cmlc2:sema3aa). Wild-type clutchmates (n = 16) were used as controls for cmlc2:sema3aa animals (n = 13). Data are represented as mean ± SEM. *p < 0.05, Mann-Whitney Rank Sum. G) Quantification of surface innervation as measured by acetylated alpha-tubulin staining, in cmlc2:sema3aa (n=6) and Wild-type clutchmate controls (n=5). Data are represented as mean ± SD. *p < 0.05, Mann-Whitney Rank Sum. H–J) Section images of 30 dpa ventricular apices of wild-type (D) or cmlc2:sema3aa (E) animals stained with Acid-Fuschin Orange. Scale bar represents 100 μm. K) Quantification of regeneration between cmlc2:sema3aa and wildtype siblings were compared at 30 dpa. Hearts (H–J) were scored for regeneration, with 1 indicating complete regeneration (H), 2 indicating partial regeneration (I), and 3 indicating a block in regeneration (J). Data represent percent of total heart per score. *p < 0.05, Fisher’s exact.
Figure 2
Figure 2. Pharmacological Inhibition of Cholinergic Nerve Function Reduces Cardiomyocyte Proliferation in Zebrafish and Neonatal Mice
A) Zebrafish hearts were fixed and immunostained for PCNA and Mef2C at 7 days after surgical amputation. Hearts derived from zebrafish treated with water (Control) displayed notable cardiomyocyte proliferation. B) Atropine treated zebrafish exhibited a reduction in proliferating cardiomyocytes. C) PCNA and Mef2c staining at 7 dpa for propranolol treated zebrafish. Control and propranolol treated zebrafish showed equivalent cardiomyocyte proliferation. D) PCNA and Mef2c staining at 7 dpa for methoctramine treated zebrafish showed significant reduction in cardiomyocyte proliferation. Boxed regions in A–D are shown at higher zoom in the left panels. E) Quantification of proliferating cardiomyocytes showing a significant reduction of the number of proliferating cardiomyocytes in atropine and methoctramine treated zebrafish compared to control water and propranolol treated zebrafish. F) Schematic of atropine injection strategy in neonatal mice. G) Mouse hearts were fixed and immunostained for phospho Histone H3 (pH3) and cardiac Troponin T (cTnnt) at 7 dpr in vehicle and atropine treated mice. The upper panel shows a high magnification image of a pH3+ cardiomyocyte. Scale bar, 50 μm. H) Quantification of the number of proliferating cardiomyocytes at 7 days post apical resection showing a significant decrease of proliferating cardiomyocytes in neonatal mice. I) Immunostaining of Aurora B and cTnnt. Scale bar, 50 μm. J) Quantification of the Aurora B+ cardiomyocytes showing a significant reduction in the number of Aurora B+ cardiomyocytes in atropine treated mice. K) Quantification of the number of nuclei in heart sections of vehicle and atropine treated mice showing no significant differences between treatments. L) Body weights of vehicle and atropine treated mice following sham and resection showing a significant reduction in body weights of atropine resected mice but no changes in sham-operated mice. Data presented as mean ± SEM, where p<0.05 was considered statistically significant. See also Figure S1.
Figure 3
Figure 3. Left Vagotomy as a Model for Mechanical Denervation in the Neonatal Mouse
A) Schematic depiction of the left vagotomy surgery in neonatal mice. B) Immunohistochemistry of the neuronal marker Tubb3 of the resected vagus nerve, nuclei stained with DAPI. Scale bar, 50 μm. C) qPCR gene expression analysis of the M2 receptor levels in sham operated and vagotomized neonatal mice, showing an upregulation of M2 receptor expression following vagotomy. D) qPCR expression profile of cell cycle and nerve secreted factors show significant downregulation in vagotomy compared to unoperated animals (n=4, p<0.05). E) Heart rate measurements at 7 days following left vagotomy showing similar heart rates in both control and vagotomized mice.
Figure 4
Figure 4. Mechanical Denervation Reduces Cardiomyocyte Proliferation and Heart Regeneration in the Neonatal Mouse
A) Schematic of neonatal vagotomy and myocardial infarction strategy in neonatal mice. B) Kaplan-Meier survival curve of MI and MI + Vagotomy mice. A significant reduction in survival of MI + Vagotomy mice was observed as assessed by Kaplan Meier analysis. C) Immunostaining of pH3 and cTnnt showing high levels of proliferating myocytes in MI hearts at 7 dpr, while a marked decrease in the levels of proliferating cardiomyocytes in MI + Vagotomy hearts. Scale bar, 50 μm. D) Quantification of the number of proliferating cardiomyocytes showing a significant decrease of proliferating cardiomyocytes following vagotomy and myocardial infarction. E) Quantification of the number of proliferating non-myocytes showing no significant changes between groups. F) Immunostaining of Aurora B and cTnnt. G) Quantification of the number of Aurora B cardiomyocytes showing a significant reduction in the number of Aurora B+ cardiomyocytes following MI+Vagotomy. H) Heart weight to body weight (HW/BW) ratio showing slightly reduced but not significant difference in the MI + Vagotomy heart. I) Trichrome staining of MI + Vagotomy and MI hearts at 21 dpr, showing incomplete regeneration and persistence of a fibrotic scar in vagotomized mice. Scale bar, 1 mm. J) Quantification of regeneration in MI and MI + Vagotomy mice. 1 indicates complete regeneration, 2 indicates partial regeneration, and 3 indicates a block in regeneration. Data represent total heart per score, 2×3 contingency analysis, p<0.05. Data presented as mean ± SEM, where p<0.05 was considered statistically significant. See also Figure S2.
Figure 5
Figure 5. Rescue of Mechanically Denervated Mice by Nrg1 and Ngf
A) Schematic of neonatal rat cardiomyocyte treatment with acetylcholine (Ach), Nrg1 and Ngf. B) 3H thymidine incorporation showing increased DNA synthesis in cardiomyocytes treated with Nrg1, but not Acetylcholine or Ngf. C) Schematic of injections of recombinant Nrg1 and Ngf in neonatal mice following MI + Vagotomy. D) Immunostaining of pH3 and cTnnt showing high levels of proliferating myocytes in treated mice at 7 days post injury compared to controls. Scale bar, 50 μm. E) Quantification of the number of proliferating myocytes following Nrg1 and Ngf injection showing higher number of proliferating myocytes compared to controls. F) Immunostaining of Aurora B and cTnnt. Scale bar, 50 μm. G) Quantification of the number of Aurora B cardiomyocytes showing a significant increase in the number of Aurora B+ cardiomyocytes in Nrg1/Ngf treated mice compared to controls. H) Trichrome staining at 21 days post injury, showing reduced scare in Nrg1 and Ngf treated mice. Scale bar, 1 mm. I) Quantification of regeneration in vehicle and Nrg1 + Ngf treated mice showing a significant higher regeneration scores in Nrg1 + Ngf treated mice. 1 indicates complete regeneration, 2 indicates partial regeneration, and 3 indicates a block in regeneration. Data represent total heart per score, 2×3 contingency analysis, p<0.05. J) Schematic of carbachol injections following MI at P7. K) Immunostaining of pH3 and cTnnt to detect mitotic cardiomyocytes. Scale bar, 50 μm. L) Quantification of mitotic cardiomyocytes showing no significant increase in myocyte cell cycle activity in carbachol treated mice. Data presented as mean ± SEM, where p<0.05 was considered statistically significant.
Figure 6
Figure 6. Immune Response Genes are Differentially Expressed Following Mechanical Denervation
A) K-means clustering of all genes differentially expressed across hearts from animals that had undergone sham operation, apical resection, or apical resection and left vagotomy surgeries. B) Gene ontology biological processes of genes significantly up regulated in resected versus sham hearts and also significantly downregulated in resected+vagotomy versus resected hearts. C) K-means clustering and FPKM plots of Immune response genes significantly up regulated in resected versus sham hearts.
Figure 7
Figure 7. Proposed Model of Nerve Dependence of Heart Regeneration
A schematic showing the proposed role that nerves play on cardiomyocyte proliferation and the impact of pharmacological, genetic and mechanical denervation on heart regeneration.

References

    1. Aurora AB, Porrello ER, Tan W, Mahmoud AI, Hill JA, Bassel-Duby R, Sadek HA, Olson EN. Macrophages are required for neonatal heart regeneration. The Journal of clinical investigation. 2014;124:1382–1392. - PMC - PubMed
    1. Bersell K, Arab S, Haring B, Kuhn B. Neuregulin1/ErbB4 signaling induces cardiomyocyte proliferation and repair of heart injury. Cell. 2009;138:257–270. - PubMed
    1. Bryant DM, O’Meara CC, Ho NN, Gannon J, Cai L, Lee RT. A systematic analysis of neonatal mouse heart regeneration after apical resection. Journal of molecular and cellular cardiology. 2015;79:315–318. - PMC - PubMed
    1. Chen J, Huang ZP, Seok HY, Ding J, Kataoka M, Zhang Z, Hu X, Wang G, Lin Z, Wang S, et al. mir-17–92 cluster is required for and sufficient to induce cardiomyocyte proliferation in postnatal and adult hearts. Circulation research. 2013;112:1557–1566. - PMC - PubMed
    1. Chen LN, Zang WJ, Yu XJ, Liu J, Li DL, Kong SS, Lu J, Xu XL. Compensatory recovery of vagal control of hemodynamics after unilateral vagotomy. Physiological research/Academia Scientiarum Bohemoslovaca. 2008;57:119–132. - PubMed

Publication types

MeSH terms

Associated data