. 2015 Sep 14;34(5):577-91.
doi: 10.1016/j.devcel.2015.06.023. Epub 2015 Aug 6.

An Integrated Transcriptome Atlas of Embryonic Hair Follicle Progenitors, Their Niche, and the Developing Skin

Affiliations

An Integrated Transcriptome Atlas of Embryonic Hair Follicle Progenitors, Their Niche, and the Developing Skin

Rachel Sennett et al. Dev Cell. .

Abstract

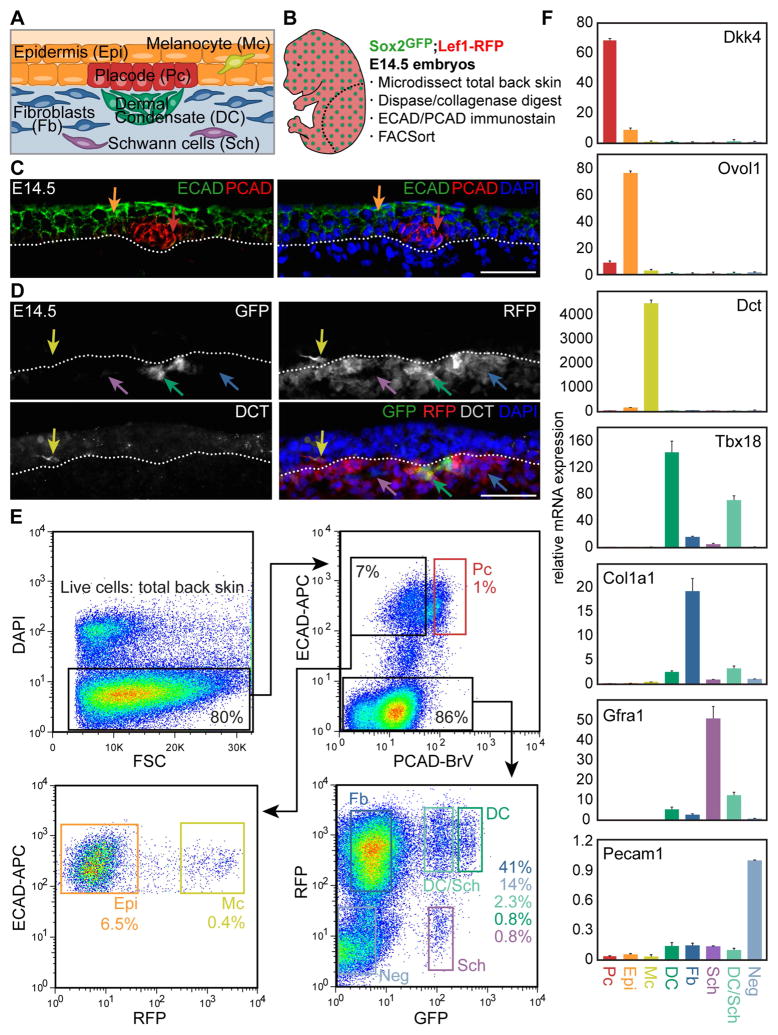
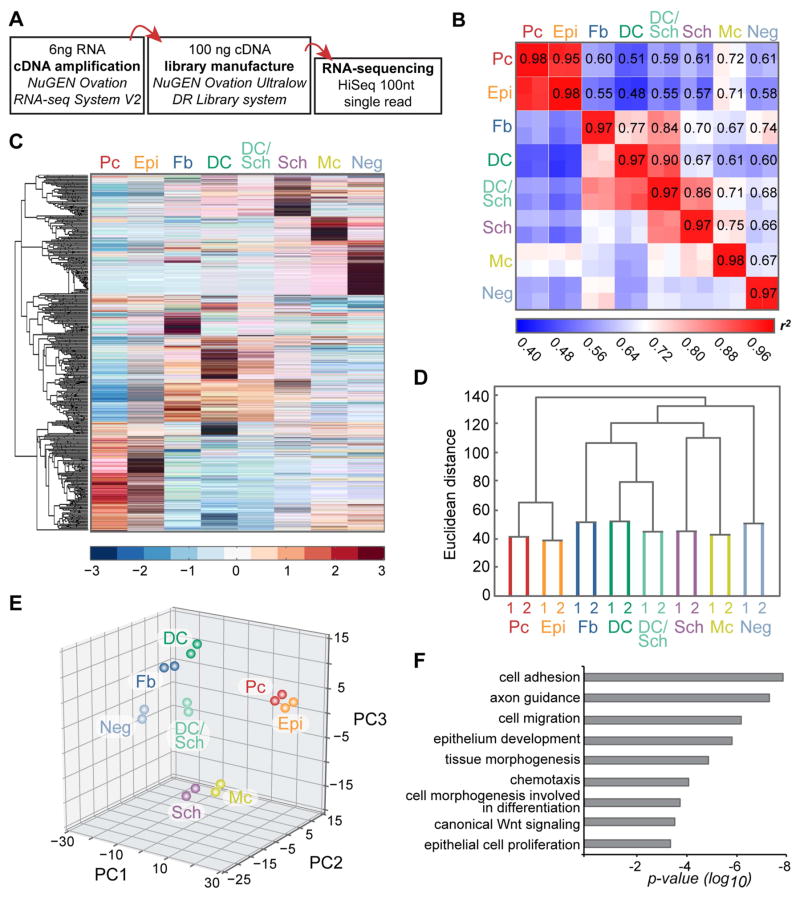
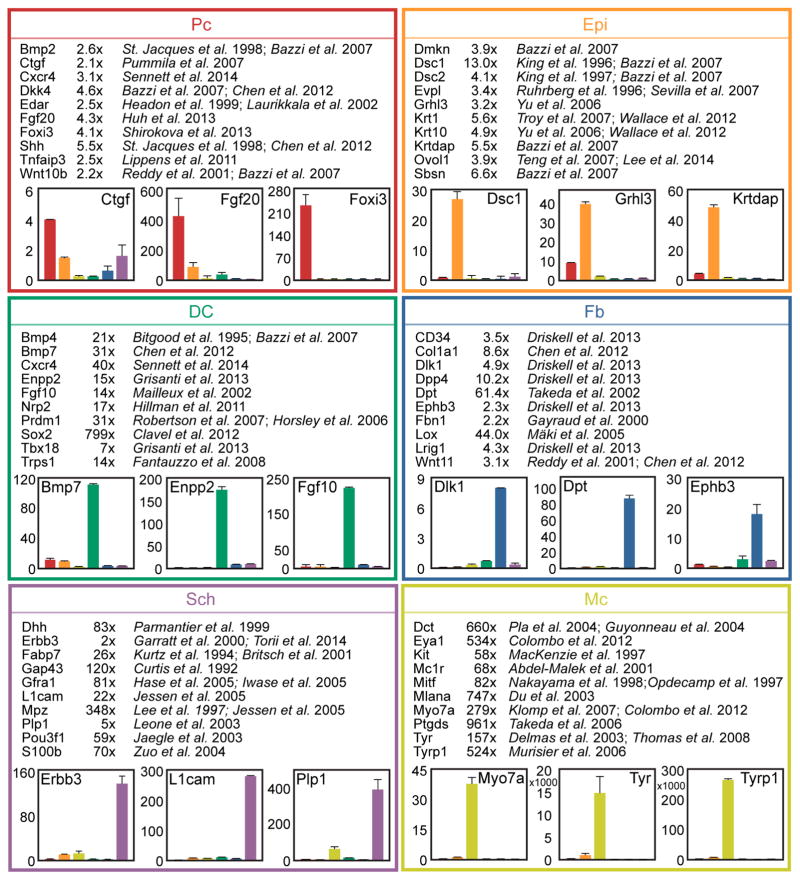
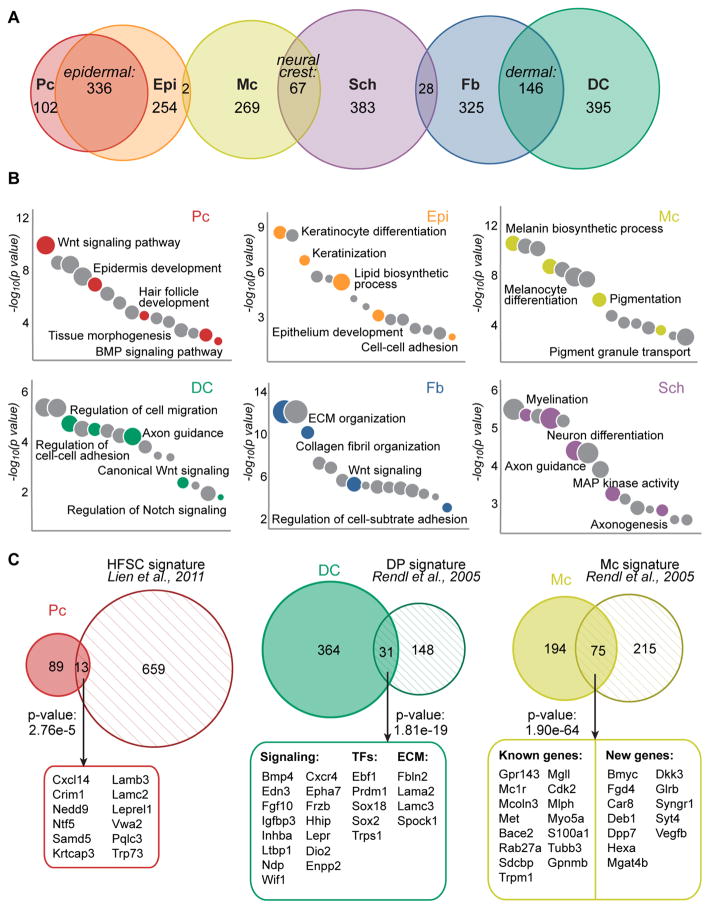
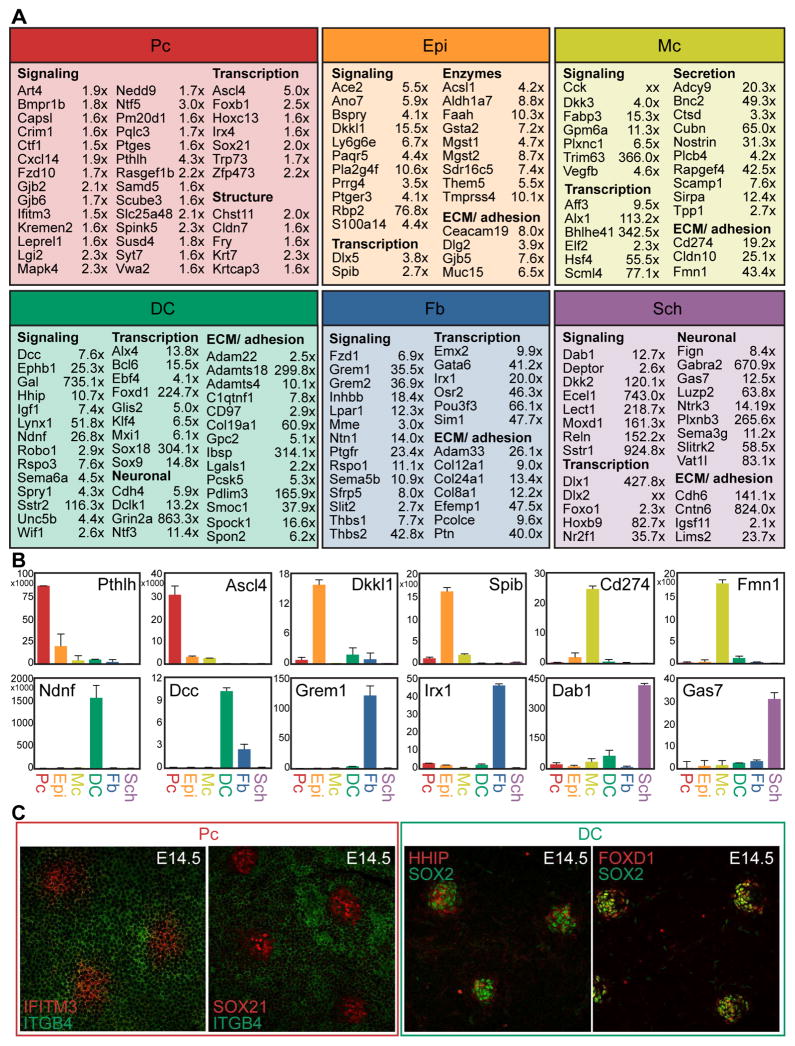
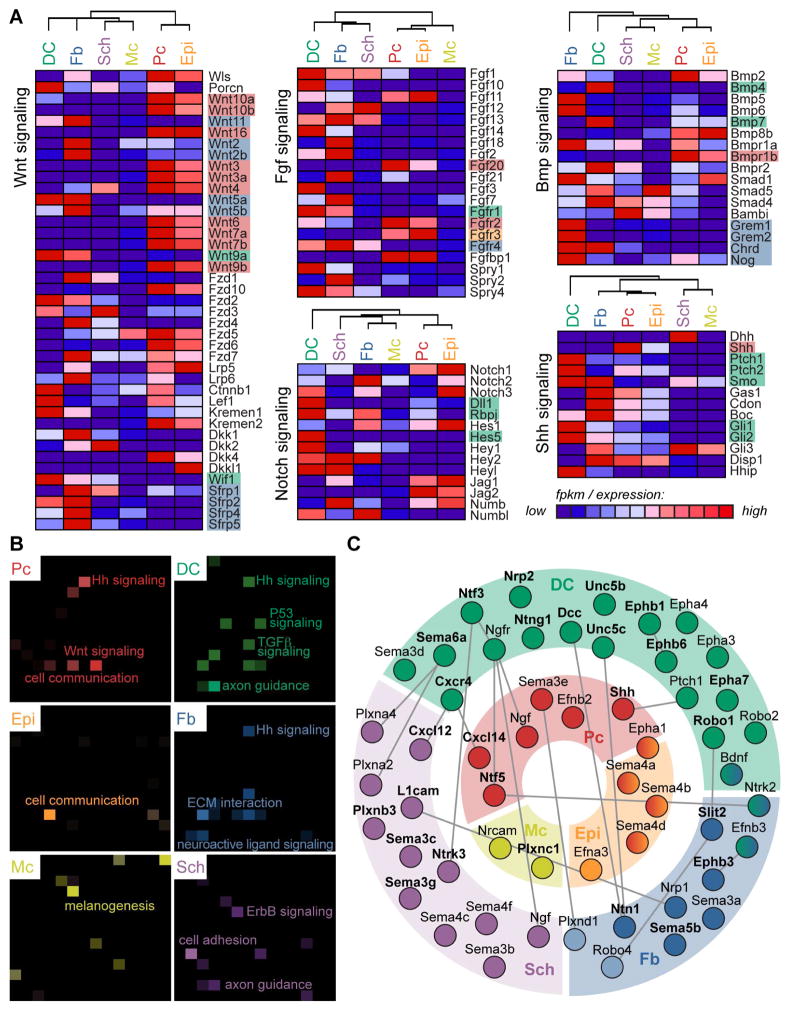
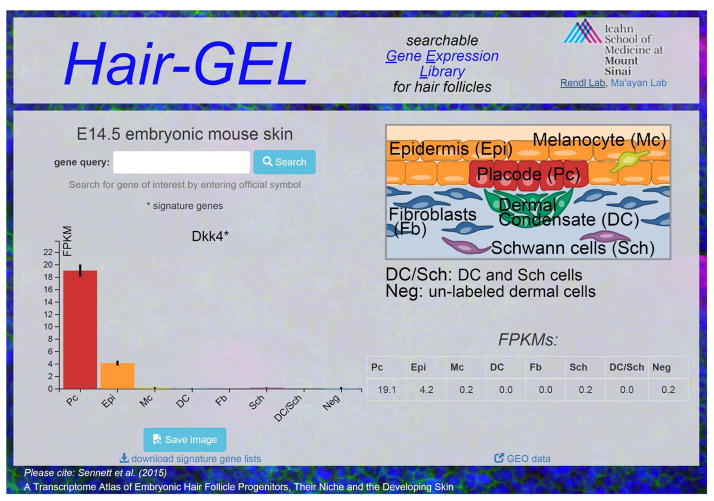
Defining the unique molecular features of progenitors and their niche requires a genome-wide, whole-tissue approach with cellular resolution. Here, we co-isolate embryonic hair follicle (HF) placode and dermal condensate cells, precursors of adult HF stem cells and the dermal papilla/sheath niche, along with lineage-related keratinocytes and fibroblasts, Schwann cells, melanocytes, and a population inclusive of all remaining skin cells. With next-generation RNA sequencing, we define gene expression patterns in the context of the entire embryonic skin, and through transcriptome cross-comparisons, we uncover hundreds of enriched genes in cell-type-specific signatures. Axon guidance signaling and many other pathway genes are enriched in multiple signatures, implicating these factors in driving the large-scale cellular rearrangements necessary for HF formation. Finally, we share all data in an interactive, searchable companion website. Our study provides an overarching view of signaling within the entire embryonic skin and captures a molecular snapshot of HF progenitors and their niche.


Figures

Figure 1
Figure 1. Multicolor cell sorting of embryonic hair follicle progenitors, niche and key skin cell populations
(A) Schematic of embryonic day (E)14.5 skin with early stage hair follicle. (B) Outline of cell sorting strategy from E14.5 Sox2GFP/Lef1-RFP double-transgenic skin. Diagram illustrates the back skin area microdissected for analysis. (C) Immunofluorescence staining for E-cadherin (ECAD) marks all epithelial cells (Epi, orange arrow) and P-cadherin (PCAD) is highest in placode cells (Pc, red arrow). Dotted line demarcates basement membrane. DAPI highlights all nuclei. (D) Sox2GFP/Lef1-RFP E14.5 back skin includes GFP+/RFP+ dermal condensate cells (DC, green arrow), GFPRFP+ dermal fibroblasts (Fb, blue arrow), GFPlowRFP Schwann cells (Sch, purple arrow); immunofluorescence for DCT confirms RFP+ cells in the epidermis are melanocytes (Mc, yellow arrow). (E) FACS plots and gates for cell sorting. Starting from live cells, 8 distinct gates mark HF progenitors, niche cells, 4 other specific cell types and 2 mixed cell populations inclusive of the entire embryonic back skin. (F) qRT-PCR for known marker genes demonstrates high enrichment for each purely isolated cell type. Data are mean ± SD from 2 measurements. Scale bars are 50 μm in C, D. See also Figure S1.
Figure 2
Figure 2. Cell population-level analyses of RNA-sequencing data from embryonic skin cell types
(A) Workflow of sample preparation for RNA-sequencing. (B) Heat map of coefficient of determination (r2) for gene expression profiles of all isolated cell populations. (C) Hierarchical clustering of differentially expressed genes. Heat map illustrates distinct clusters of enriched gene expression in all isolated embryonic skin cell types. (D) Hierarchical clustering analysis of embryonic skin cell populations. Biological replicates cluster together. Epithelial, mesenchymal and neural crest-derived cells group separately. Y-axis, Euclidean distance. (E) Principal component analysis with PC1 (43.74% variance captured); PC2 (16.97% variance captured); PC3 (15.81% variance captured). (F) Gene ontology analysis for differentially expressed genes. Shown are significantly overrepresented functional categories in embryonic skin.
Figure 3
Figure 3. Comprehensive representation of known cell type-specific markers
Established markers are appropriately enriched in the RNA-seq dataset. Ten representative marker genes and the relevant reference are shown for each cell type. Numbers are fold change in FPKM difference between Pc vs. Epi, DC vs. Fb, Sch vs. Mc. qRT-PCR verification on independently sorted cells confirmed cell type-specific gene expression. Data are mean ± SD from 2 measurements.
Figure 4
Figure 4. Molecular signatures of embryonic HF progenitors, niche cells and other key embryonic skin cell types
(A) Venn diagrams of cell type-specific gene expression signatures. The overlaps represent genes enriched in epithelial, mesenchymal and neural crest cell types compared to all other populations. Note reduced overlap in unrelated cell lineages. Specific gene lists are provided in Tables S1, S2. (B) Gene ontology analysis of cell type-specific gene signatures. Notable terms are highlighted, all terms are listed in Table S3. (C) Embryonic gene signatures in comparison to previously published signatures of related cell types from adult hair follicles, with select common factors listed. All common factors are listed in Table S4. Statistically significant overlap was calculated with Fisher’s exact test.
Figure 5
Figure 5. Cell type-specific RNA-sequencing reveals many new signature genes
(A) Select enriched genes for each cell type are listed along with the fold change of gene expression as measured by FPKM. Fold change is measured as Pc vs. Epi, DC vs. Fb, Sch vs. Mc. Genes are organized according to functional categorization. FDR of q<0.05 for all genes. (B) qRT-PCR verification of select signature genes for each cell type. Data are mean ± SD from 2 measurements. See also Figure S3. (C) Immunofluorescence staining verification of selected signature genes for the Pc and DC. Whole-mount view of E14.5 skin. See also Figure S3.
Figure 6
Figure 6. Genes from defined signaling pathways are highly expressed and specifically partitioned in embryonic skin
(A) Genes involved in Wnt, Fgf, Bmp, Notch and Shh signaling were mined from the KEGG database and represented in the heat map if expressed (FPKM >1) in embryonic skin. Discussed genes are highlighted and color-coded for cell type. See also Figure S4. (B) KEGG pathway analysis (Enrichr) for each cell type-specific molecular signature. Brighter tiles in the canvas indicate greater significance; notable terms are labeled. All terms and relevant genes are listed in Table S5. (C) Signature (bolded) and other enriched genes related to axon guidance signaling are localized to specific cell types in embryonic skin. Connections indicate known interactions between two factors as mined from literature.
Figure 7
Figure 7. Hair-GEL: an interactive, searchable online Gene Expression Library
Representative screenshot from companion website. The site hosts all raw data for download.

Comment in

References

    1. Ahn Y. Signaling in tooth, hair, and mammary placodes. Curr Top Dev Biol. 2015;111:421–459. - PubMed
    1. Andl T, Reddy ST, Gaddapara T, Millar SE. WNT signals are required for the initiation of hair follicle development. Dev Cell. 2002;2:643–653. - PubMed
    1. Bazzi H, Fantauzzo KA, Richardson GD, Jahoda CAB, Christiano AM. Transcriptional profiling of developing mouse epidermis reveals novel patterns of coordinated gene expression. Dev Dyn. 2007a;236:961–970. - PubMed
    1. Bazzi H, Fantauzzo KA, Richardson GD, Jahoda CAB, Christiano AM. The Wnt inhibitor, Dickkopf 4, is induced by canonical Wnt signaling during ectodermal appendage morphogenesis. Dev Biol. 2007b;305:498–507. - PubMed
    1. Biernaskie J, Paris M, Morozova O, Fagan B, Marra M, Pevny L, Miller FD. SKPs derive from hair follicle precursors and exhibit properties of adult dermal stem cells. Cell Stem Cell. 2009;5:610–623. - PMC - PubMed

Publication types

Associated data