Review
. 2015 Aug 10;17(1):72.
doi: 10.1186/s12968-015-0174-5.

4D flow cardiovascular magnetic resonance consensus statement

Affiliations
Review

4D flow cardiovascular magnetic resonance consensus statement

Petter Dyverfeldt et al. J Cardiovasc Magn Reson. .

Abstract

Pulsatile blood flow through the cavities of the heart and great vessels is time-varying and multidirectional. Access to all regions, phases and directions of cardiovascular flows has formerly been limited. Four-dimensional (4D) flow cardiovascular magnetic resonance (CMR) has enabled more comprehensive access to such flows, with typical spatial resolution of 1.5×1.5×1.5 - 3×3×3 mm(3), typical temporal resolution of 30-40 ms, and acquisition times in the order of 5 to 25 min. This consensus paper is the work of physicists, physicians and biomedical engineers, active in the development and implementation of 4D Flow CMR, who have repeatedly met to share experience and ideas. The paper aims to assist understanding of acquisition and analysis methods, and their potential clinical applications with a focus on the heart and greater vessels. We describe that 4D Flow CMR can be clinically advantageous because placement of a single acquisition volume is straightforward and enables flow through any plane across it to be calculated retrospectively and with good accuracy. We also specify research and development goals that have yet to be satisfactorily achieved. Derived flow parameters, generally needing further development or validation for clinical use, include measurements of wall shear stress, pressure difference, turbulent kinetic energy, and intracardiac flow components. The dependence of measurement accuracy on acquisition parameters is considered, as are the uses of different visualization strategies for appropriate representation of time-varying multidirectional flow fields. Finally, we offer suggestions for more consistent, user-friendly implementation of 4D Flow CMR acquisition and data handling with a view to multicenter studies and more widespread adoption of the approach in routine clinical investigations.


Figures
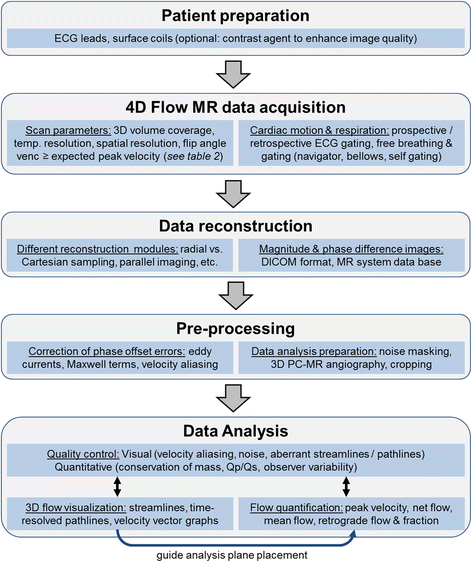
Fig. 1
Fig. 1
Recommended workflow for clinical application of 4D Flow CMR with the main components of 1) patient preparation, 2) data acquisition in the magnet, 3) data reconstruction, 4) pre-processing of the reconstructed data, and 5) data analysis
Fig. 2
Fig. 2
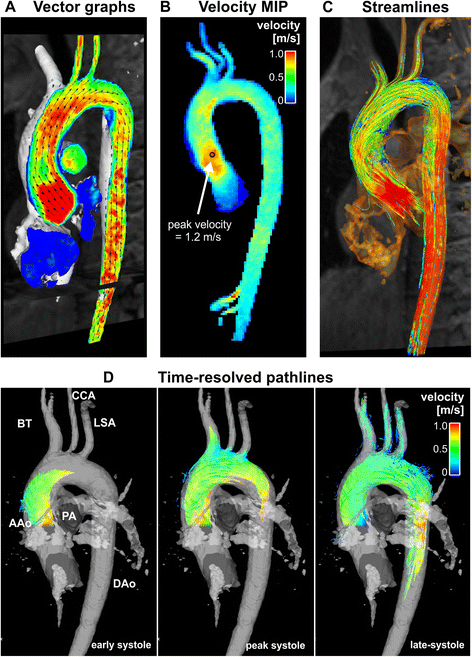
Examples of 4D Flow CMR visualization techniques. All examples are based on data acquired in the aorta of a healthy volunteer. In these examples, flow visualization is overlaid onto a segmentation of the aorta. a An oblique slice that transects the aorta has been color-coded by flow speed and combined with a graph of velocity vectors which here displays the speed and direction of blood velocity in black arrows at a coarser grid than the acquired voxels. This type of visualization provides a quick overview of velocity fields. b A maximum intensity projection (MIP) image of flow speed permits identification of areas of elevated velocity and the point of peak velocity while displaying the peak velocities of the whole volume projected onto this single slice image. c Streamlines are instantaneously tangent to the velocity vector field and are useful to visualize 3D velocity fields at discrete time points. Here, the peak systolic velocity field is shown. d Pathlines are the trajectories that massless fluid particles would follow through the dynamic velocity field. Pathlines are suitable for studies of the path of pulsatile blood flow over time. This example shows pathlines emitted from a plane in the ascending aorta at the onset of systole and traced to early systole (left), peak systole (middle) and late systole (right). All figures have been color-coded based on flow speed using the same color-window settings according to the scale shown in (b) and (d). In a, c and d, the visualizations have been combined with a PC-MRA isosurface which has been derived from the 4D Flow CMR data
Fig. 3
Fig. 3
Examples of 4D Flow CMR visualization techniques, demonstrated on intracardiac flow data acquired in a healthy volunteer. In these examples, flow visualization is overlaid onto a 2D bSSFP acquisition in a three-chamber view. a Pathlines are the trajectories that massless fluid particles would follow through the dynamic velocity field and are suitable for studies of the path of pulsatile blood flow over time. Here, the transit of blood through the left ventricle (LV) is shown by pathlines emitted from the mitral valve at the time point of peak A-wave and traced to the time point of early systole systole. The timing of the ECG (TECG) is included for reference. b-d Streamlines are instantaneously tangent to the velocity vector field and are useful to visualize 3D velocity fields at discrete time points. Here, streamlines generated in a long-axis plane show parts of the intracardiac velocity field at the time points of b peak early filling (E-wave), c peak late filling (A-wave), and d peak systole
Fig. 4
Fig. 4
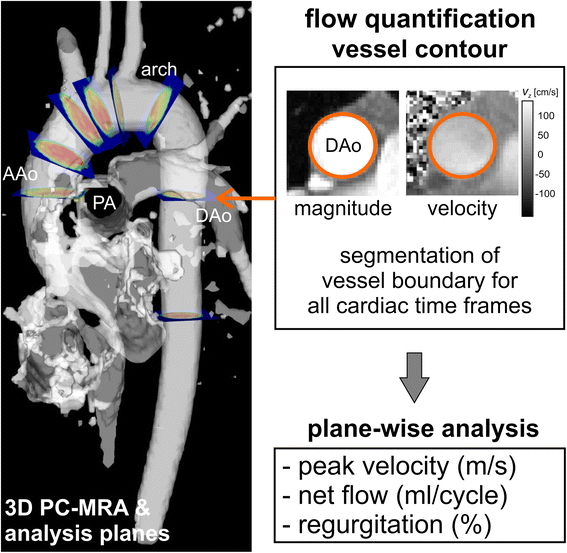
Illustration of retrospective flow quantification. For retrospective quantification of flow parameters based on 2D analysis, planes can be positioned at any anatomic location. In this example, an isosurface of 3D PC-MRA data derived from the 4D Flow CMR data (gray shaded) has been used to guide positioning analysis planes throughout the thoracic aorta. For each analysis plane, the vessel contours are segmented for all cardiac time frames to calculate flow volume, peak velocity and retrograde fraction

References

    1. Firmin DN, Gatehouse PD, Konrad JP, Yang GZ, Kilner PJ, Longmore DB. Rapid 7-dimensional imaging of pulsatile flow. Computers in Cardiology IEEE computer Society, London. 1993;14:353–356.
    1. Wigstrom L, Sjoqvist L, Wranne B. Temporally resolved 3D phase-contrast imaging. Magn Reson Med. 1996;36:800–803. - PubMed
    1. Kozerke S, Hasenkam JM, Pedersen EM, Boesiger P. Visualization of flow patterns distal to aortic valve prostheses in humans using a fast approach for cine 3D velocity mapping. J Magn Reson Imaging. 2001;13:690–698. - PubMed
    1. Markl M, Chan FP, Alley MT, Wedding KL, Draney MT, Elkins CJ, et al. Time-resolved three-dimensional phase-contrast MRI. J Magn Reson Imaging. 2003;17:499–506. - PubMed
    1. Richter Y, Edelman ER. Cardiology Is Flow. Circulation. 2006;113:2679–2682. - PubMed

Publication types

MeSH terms