. 2015 Aug 18;12(7):1159-68.
doi: 10.1016/j.celrep.2015.07.029. Epub 2015 Aug 6.

MBNL Sequestration by Toxic RNAs and RNA Misprocessing in the Myotonic Dystrophy Brain

Affiliations

MBNL Sequestration by Toxic RNAs and RNA Misprocessing in the Myotonic Dystrophy Brain

Marianne Goodwin et al. Cell Rep. .

Abstract

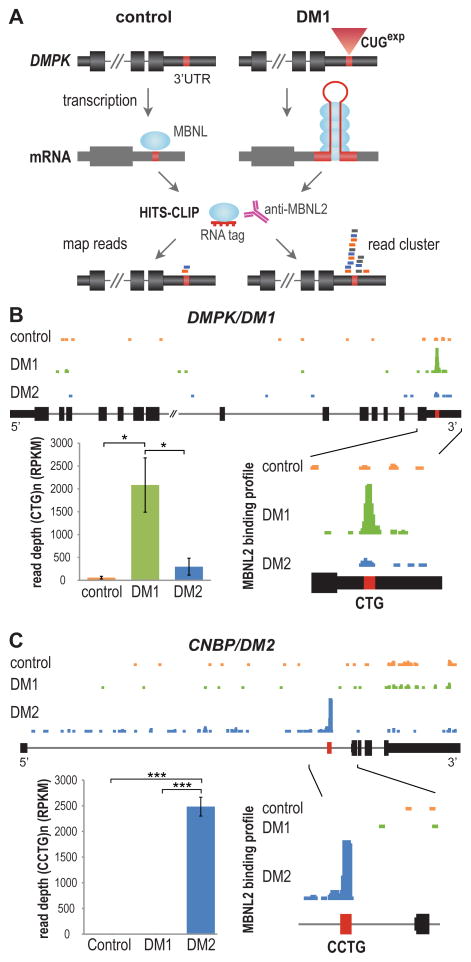
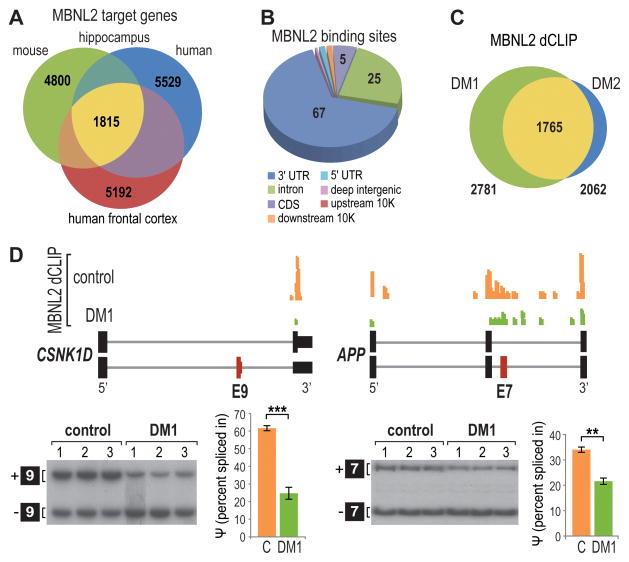
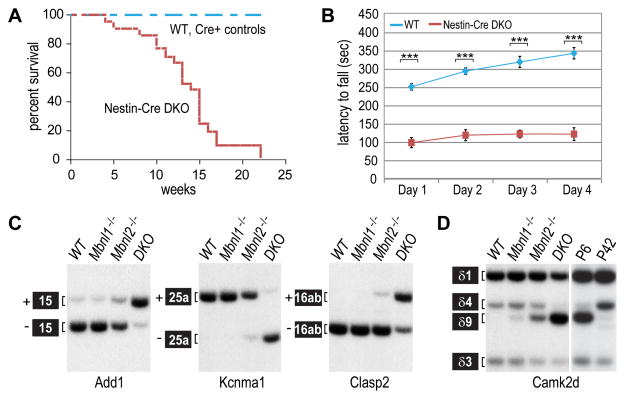
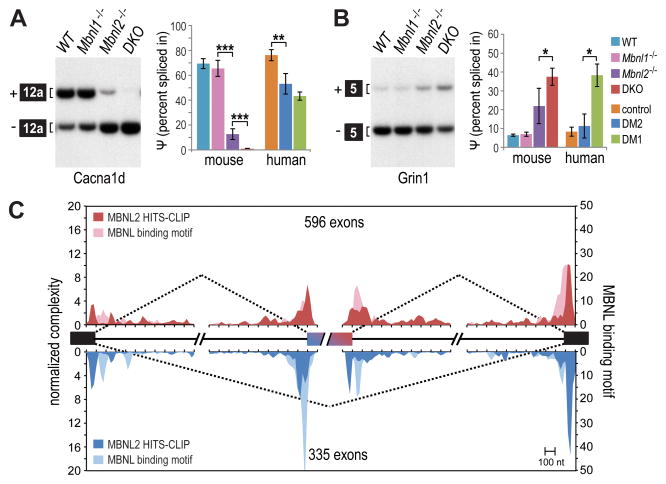
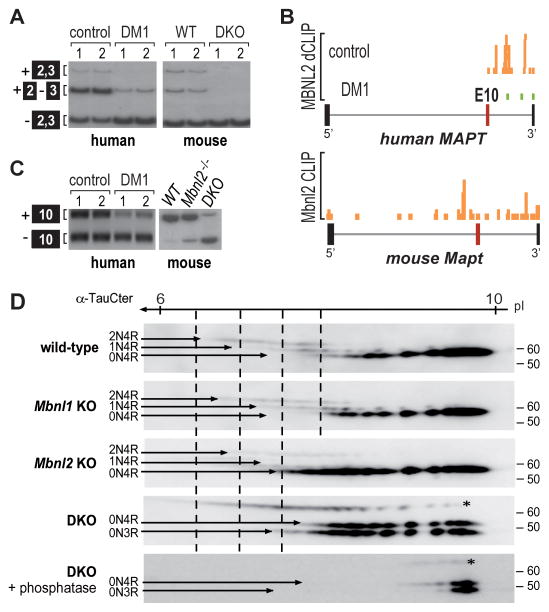
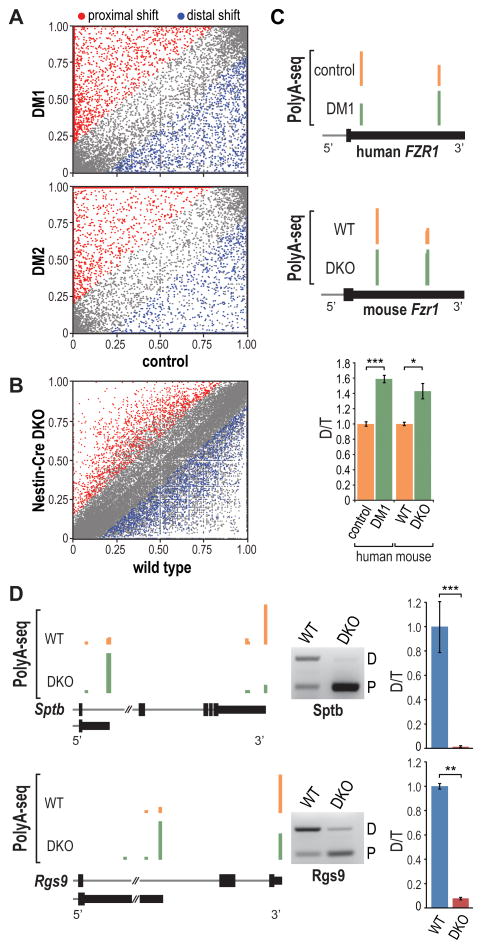
For some neurological disorders, disease is primarily RNA mediated due to expression of non-coding microsatellite expansion RNAs (RNA(exp)). Toxicity is thought to result from enhanced binding of proteins to these expansions and depletion from their normal cellular targets. However, experimental evidence for this sequestration model is lacking. Here, we use HITS-CLIP and pre-mRNA processing analysis of human control versus myotonic dystrophy (DM) brains to provide compelling evidence for this RNA toxicity model. MBNL2 binds directly to DM repeat expansions in the brain, resulting in depletion from its normal RNA targets with downstream effects on alternative splicing and polyadenylation. Similar RNA processing defects were detected in Mbnl compound-knockout mice, highlighted by dysregulation of Mapt splicing and fetal tau isoform expression in adults. These results demonstrate that MBNL proteins are directly sequestered by RNA(exp) in the DM brain and introduce a powerful experimental tool to evaluate RNA-mediated toxicity in other expansion diseases.


Figures

Figure 1
Figure 1. HITS-CLIP Identifies MBNL2-RNAexp Interactions in DM Brain
(A) Strategy for identifying RBP-RNAexp binding interactions using HITS-CLIP. For DM1, a CTG repeat (red box) in the DMPK 3′UTR (coding exons, thick black boxes; UTRs, thin black boxes; introns, thin lines) expands in disease (CUGexp, red triangle). Upon transcription, the mRNA (grey) forms a stem-loop that sequesters MBNL2 (blue ovals). HITS-CLIP of MBNL proteins using DM1 (right), but not control (left), tissue generates a large increase in reads clustered over the repeat region (bottom right). (B) MBNL2 binding profile reveals enriched binding to the DMPK CTGexp in DM1 brain. UCSC browser view showing wiggle plots of MBNL2 HITS-CLIP binding in the DMPK reference gene for control (orange), DM1 (green), and DM2 (blue) human hippocampus. Zoomed-in view of the terminal exon (bottom right) showing a clustered read peak over the CTG repeat region for DM1 only. Quantification (bottom left) of MBNL2 CLIP peak read depth (RPKM) over the DMPK CTG repeat region shows a significant enrichment (36-fold) over controls (n = 3 per group, data are reported ± SEM, *p < 0.05). (C) MBNL2 HITS-CLIP binding profile for CNBP. Intron 1 (bottom right) containing the CCTG repeat region (red box) is shown. Quantification (bottom left) of average peak read depth over CCTG repeats showing a 79-fold enrichment in DM2 over controls (n = 3 per group, data are reported ± SEM, ***p < 0.001).
Figure 2
Figure 2. Depletion of MBNL2 Binding for Mis-regulated Exons in DM1
(A) Venn diagram of overlapping MBNL2 target genes in human hippocampus and frontal cortex and mouse hippocampus. (B) Pie chart of MBNL2 binding site distribution in human hippocampus. (C) Venn diagram of common genes in DM1 and DM2 with MBNL2 depletion events identified by dCLIP analysis. (D) UCSC browser view of MBNL2 dCLIP near CSNK1D exon 9 (left) (alternative exon, red box; flanking exons, thick black boxes; introns, gray lines) and APP exon 7 (right) showing loss of binding in DM1 (green) compared to controls (orange) (n = 3 each). RT-PCR splicing analyses are also shown for CSNK1D and APP in control versus DM1 brain with corresponding percent spliced in (ψ) values (n = 3 per group, data are reported ± SEM, ***p < 0.001, **p < 0.01).
Figure 3
Figure 3. Reversal to Fetal CNS Splicing due to Combined Loss of MBNL1 and MBNL2
(A) Kaplan-Meier analysis of Mbnl1ΔE3/ΔE3, Mbnl2c/c; Nestin-Cre+/− (Nestin-Cre DKO) mice, wild type (WT, Mbnl1+/+, Mbnl2+/+) and Cre controls (Mbnl1+/+, Mbnl2+/+; Nestin-Cre+/−; Mbnl1+/+, Mbnl2c/c; Nestin-Cre+/−; Mbnl1ΔE3/ΔE3, Mbnl2c/c; Nestin-Cre−/−) (n = 21 per group). (B) Accelerating rotarod performance of Nestin-Cre DKO mice and controls (5 weeks of age) over the four day training course (n ≥ 8 per group, data are reported ± SEM, ***p < 0.001). C) RT-PCR analysis of splicing patterns in WT, Mbnl1ΔE3/ΔE3, Mbnl2 ΔE2/ΔE2, and Nestin-Cre DKO brain showing several targets (Add1, Kcnma1, Clasp2) with increased mis-splicing after compound loss of Mbnl function. (D) Reversal to fetal splicing patterns in Nestin-Cre DKO brain. The splicing patterns of four Camk2d isoforms in WT to Mbnl1ΔE3/ΔE3, Mbnl2 ΔE2/ΔE2, and Nestin-Cre DKO brain are compared to the splicing patterns of WT postnatal day (P)6 and P42 mice.
Figure 4
Figure 4. DM-relevant mis-splicing in Nestin-Cre DKO brain
(A) RT-PCR splicing analysis of Cacna1d in WT, Mbnl1ΔE3/ΔE3, Mbnl2 ΔE2/ΔE2 and Nestin-Cre DKO brain. Splicing of CACNA1D in human control, DM2, and DM1 brain shown for comparison (n = 3 per group, data are reported ± SEM, ***p < 0.001, **p < 0.01). (B) Same as (A) but splicing analysis of mouse Grin1 compared to human GRIN1 (n = 3 per group, data are reported ± SEM, *p < 0.05). (C) RNA splicing maps using human MBNL2 CLIP tags near exons mis-spliced in the DM1 frontal cortex (included exons, red; skipped exons, blue; coverage ≥ 20, |dI| ≥0.1, FDR ≤ 0.05). Also included is MBNL binding motif data, or YGCY motifs in the human genome near the mis-spliced exons, using a previously described computational procedure (included exons, light red; skipped exons, light blue) (Zhang et al., 2013).
Figure 5
Figure 5. Tau Isoform Mis-regulation in DM1 and Mbnl DKO Brain
(A) RT-PCR splicing analysis showing shift toward skipping of MAPT exons 2 and 3 in DM1 brain compared to controls and in Nestin-Cre DKO brain relative to WT. (B) MBNL2 binding is reduced near MAPT exon 10 in DM1 brain compared to controls. UCSC browser view of MBNL2 dCLIP binding profiles near MAPT exon 10 (alternative exon, red box; flanking exons, thick black boxes; introns, gray lines) in control (orange) and DM1 (green) brain (n = 3). Bottom panel shows the mouse Mbnl2 HITS-CLIP binding profile near exon 10. (C) RT-PCR analysis of MAPT/Mapt exon 10 splicing for human control versus DM1 and mouse wild-type (WT), Mbnl2 KO (Mbnl2−/−) and Nestin-Cre DKO (DKO). (D) Two-dimensional gel electrophoresis (1st dimension, 3 to 11 non-linear pH gradient strips; 2nd dimension SDS-PAGE) and immunoblot of tau isoforms (2N4R, 1N4R, 0N4R and 0N3R) in WT, Mbnl1ΔE3/ΔE3 (Mbnl1 KO), Mbnl2 ΔE2/ΔE2 (Mbnl2 KO) and Nestin-Cre DKO brain. Bottom panel corresponds to tau staining after treatment with lambda phosphatase. Tau protein was stained with the α-TauCter antibody. The N-terminal inserts correspond to inclusion/exclusion of alternative exon 2 and exon 2 + 3. The 3R and 4R isoforms correspond to isoforms without/with the exon 10 encoding sequence.
Figure 6
Figure 6. Disrupted Polyadenylation in Human DM and Mouse Mbnl DKO Brain
(A) Scatter plot representation of PolyA-seq data showing APA shifts to more distal (blue) or proximal (red) pA sites relative to the coding region in DM1 (top) and DM2 (bottom) versus control brain (FDR < 0.05, |dI| > 0.15). The data represents distal (n = 2,794), proximal (3,853), total (6,647), and no shift (25,357) in DM1 and distal (2,273), proximal (3,290), total (5,563), and no shift (27,683) in DM2. (B) Scatter plot illustrating shifts to more distal (blue) or proximal (red) pA sites in Nestin-Cre DKO versus WT brain (FDR < 0.05, |dI| > 0.15). The data represent distal (1,668), proximal (1,528), total (3,195) and no shift (47,944). (C) PolyA-seq wiggle plots showing shifts to distal polyA sites in the FZR1 3′ UTR (3′ UTR, thin black box; coding region, thick black boxes; intron, gray line) in DM1 versus control (top) and Nestin-Cre DKO versus WT (middle). RT-PCR validation (bottom) of FZR1/Fzr1 switches (distal, D; total, T; n = 3 per group, data are reported ± SEM, *p < 0.05, ***p < 0.001). (D) Wiggle plots (left) of PolyA-seq data for Sptb and Rgs9 comparing APA patterns in WT versus Nestin-Cre DKO brain. RT-PCR validation (middle) of APA changes with quantification (right) of distal (D) versus total (T) pA utilization (n = 3 per group, data are reported ± SEM, **p < 0.01, ***p < 0.001).

References

    1. Batra R, Charizanis K, Manchanda M, Mohan A, Li M, Finn DJ, Goodwin M, Zhang C, Sobczak K, Thornton CA, et al. Loss of MBNL leads to disruption of developmentally regulated alternative polyadenylation in RNA-mediated disease. Mol Cell. 2014;56:311–322. - PMC - PubMed
    1. Carpentier C, Ghanem D, Fernandez-Gomez FJ, Jumeau F, Philippe JV, Freyermuth F, Labudeck A, Eddarkaoui S, Dhaenens CM, Holt I, et al. Tau exon 2 responsive elements deregulated in myotonic dystrophy type I are proximal to exon 2 and synergistically regulated by MBNL1 and MBNL2. Biochim Biophys Acta. 2014;1842:654–664. - PubMed
    1. Charizanis K, Lee KY, Batra R, Goodwin M, Zhang C, Yuan Y, Shiue L, Cline M, Scotti MM, Xia G, et al. Muscleblind-like 2-mediated alternative splicing in the developing brain and dysregulation in myotonic dystrophy. Neuron. 2012;75:437–450. - PMC - PubMed
    1. Chi SW, Zang JB, Mele A, Darnell RB. Argonaute HITS-CLIP decodes microRNA-mRNA interaction maps. Nature. 2009;460:479–486. - PMC - PubMed
    1. Cleary JD, Ranum LP. Repeat associated non-ATG (RAN) translation: new starts in microsatellite expansion disorders. Curr Opin Genet Dev. 2014;26C:6–15. - PMC - PubMed

Publication types

Associated data