. 2015 Jul;72(7):340-8.
doi: 10.1002/cm.21234. Epub 2015 Aug 22.

TPX2 regulates neuronal morphology through kinesin-5 interaction

Affiliations

TPX2 regulates neuronal morphology through kinesin-5 interaction

Olga I Kahn et al. Cytoskeleton (Hoboken). 2015 Jul.

Abstract

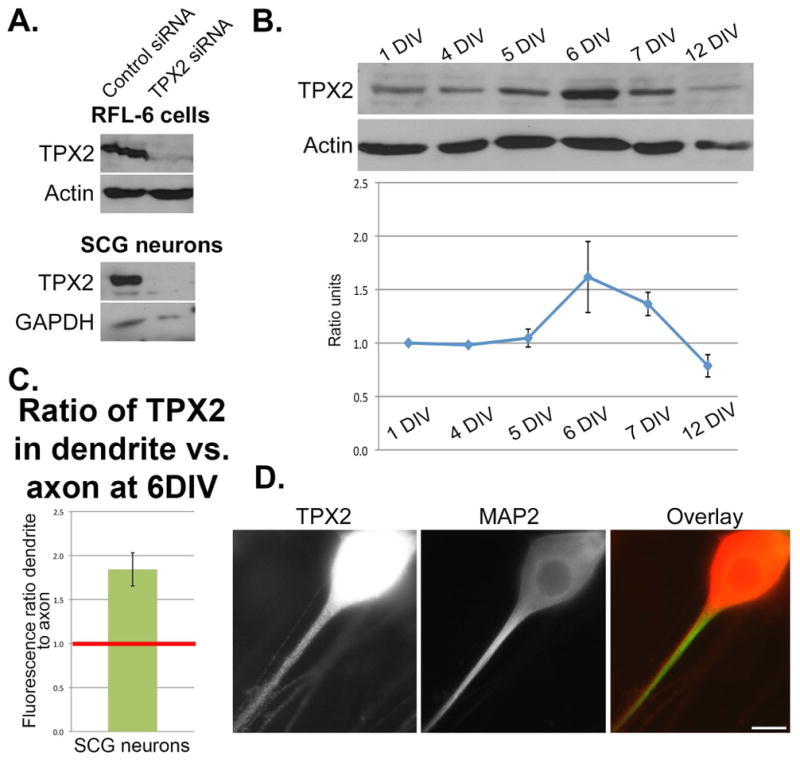
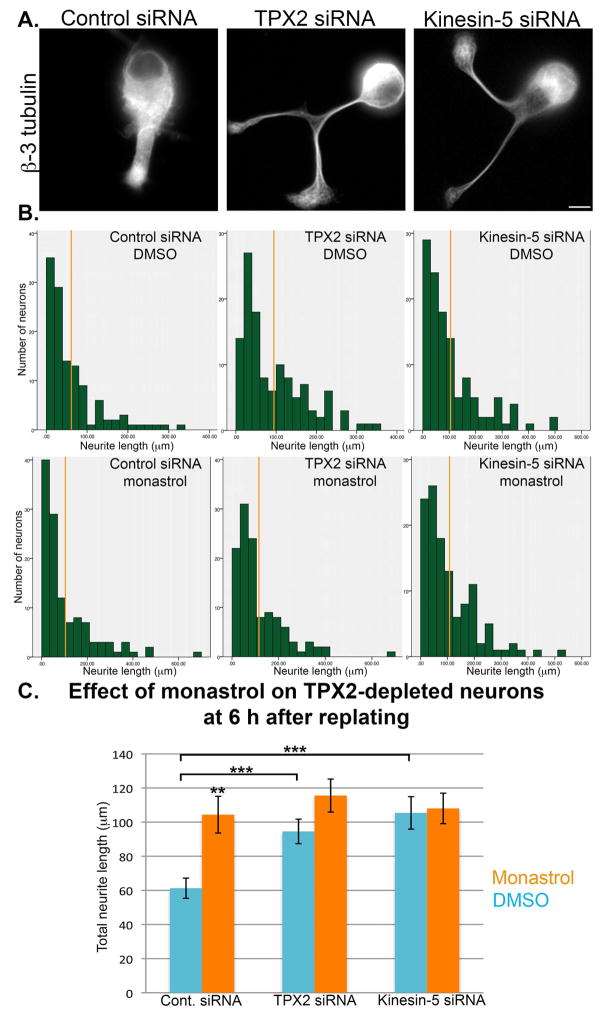
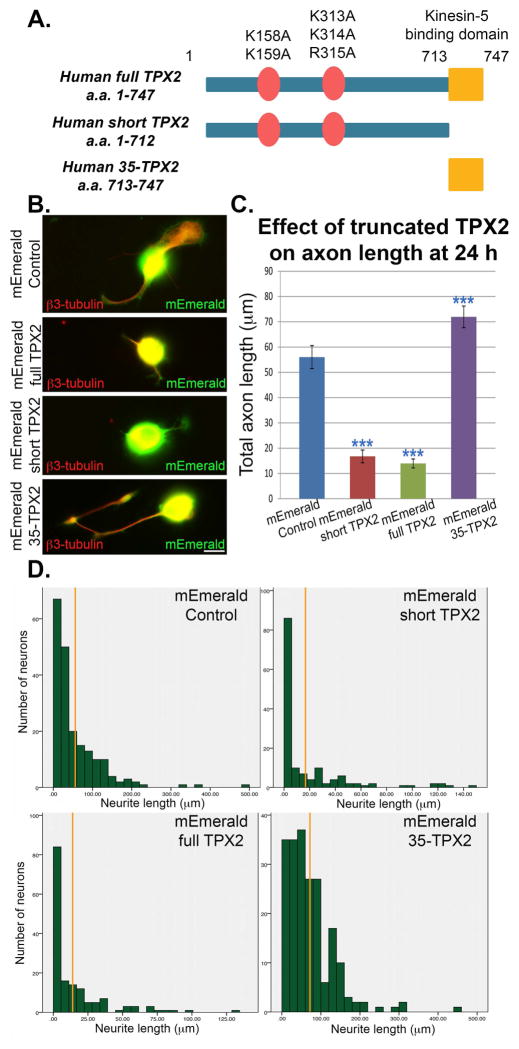
TPX2 (targeting protein for Xklp2) is a multifunctional mitotic spindle assembly factor that in mammalian cells localizes and regulates mitotic motor protein kinesin-5 (also called Eg5 or kif11). We previously showed that upon depletion or inhibition of kinesin-5 in cultured neurons, microtubule movements increase, resulting in faster growing axons and thinner dendrites. Here, we show that depletion of TPX2 from cultured neurons speeds their rate of process outgrowth, similarly to kinesin-5 inhibition. The phenotype is rescued by TPX2 re-expression, but not if TPX2's kinesin-5-interacting domain is deleted. These results, together with studies showing a spike in TPX2 expression during dendritic differentiation, suggest that the levels and distribution of TPX2 are likely to be determinants of when and where kinesin-5 acts in neurons.

Keywords: Eg5; TPX2; kif11; microtubule; molecular motor; neuron.


Conflict of interest statement

Conflict of interest: Authors declare no conflict of interest

Figures

Figure 1
Figure 1. TPX2 expression in neurons
(A) TPX2 antibody is verified to recognize endogenous TPX2 in rat RFL-6 cells and rat SCG neurons. RFL-6 cells and SCG neurons were treated with control or TPX2 siRNA and collected for Western Blot respectively after 24h and 48h. The blot was probed for TPX2 and actin or GAPDH as internal control. (B) SCG neurons were plated and collected after 1, 4, 5, 6, 7 and 12 DIV. Samples were run on Western Blot and probed for TPX2 as well as for actin as internal control. Densitometric values were measured via ImageJ and normalized first against actin and then displayed as a ratio against 1 DIV. (C) SCG neurons were cultured for 6 DIV, fixed and stained for TPX2. Fluorescence was measured using the same sized rectangle within the proximal dendrite and a bundle of axons within the same image as determined by MAP2 dendrite marker. Background fluorescence was subtracted from all measurements. A ratio of dendrite over axon fluorescence was normalized against β3-tubulin volume measurements: 1.84±(0.19)-to-1, n=28. (D) Representative images from quantifications in C are presented. TPX2 is red and MAP2 is green. Processes in the TPX2 image that do not stain for MAP2 are axons. Bar 10 μm.
Figure 2
Figure 2. TPX2-depleted neurons grow neurites as fast as kinesin-5-depleted neurons
(A) Neurons were isolated from SCGs and transfected with control, TPX2 or kinesin-5 siRNA. At 3 DIV, neurons were re-plated from plastic dishes onto glass coverslip dishes and Monastrol or DMSO (as control) was added. Neurons were fixed after 6 h, stained against β3-tubulin and quantified for total neurite length. Bar is 10 μm. (B) Data for each condition were positively skewed and graphed into a histogram. X-axis are binned neurite lengths, y-axis is frequency. Orange line denotes the mean. (C) Mann-Whitney U test showed significant difference between control siRNA DMSO (median 34.73 μm; mean 61.27±5.93 μm; n=120) and control siRNA Monastrol groups (median 54.31 μm; mean 104.35±10.77 μm; n=120; U=5608.5, p>0.01). There was also a significant difference between control siRNA DMSO group and TPX2 siRNA DMSO (median 62.75 μm; mean 94.52±7.18 μm; n=120; U=4997.5, p>0.001) and Kinesin-5 DMSO groups (median 66.99 μm; mean 105.38±9.51 μm; n=120; U=5056.5, p>0.001). There was no significant difference between TPX2 siRNA DMSO and TPX2 siRNA Monastrol (median 81.77 μm; mean 115.54±9.69 μm; n=120; U=6364, p=0.12) and between kinesin-5 siRNA DMSO and kinesin-5 siRNA Monastrol (median 71.81 μm; mean 108.02±8.93 μm; n=120; U=6827, p=0.49).
Figure 3
Figure 3. Effect of TPX2 constructs expression on neurons
(A) Full-length (mEmerald-fullTPX2), short (mEmerald-shortTPX2) and truncated (mEmerald-35TPX2) constructs were generated with the denoted modifications. (B) The three TPX2 constructs or control empty vector were individually introduced into SCG neurons via nucleofection at the time of plating. After 24 h, neurons were fixed and immunostained for β3-tubulin. Bar 10 μm. (C) Mann-Whitney U test showed significant difference between mEmerald control (median 31.61 μm; mean 56.03±4.56 μm; n=200) and mEmerald-shortTPX2 (median >1 μm; mean 16.76±2.52 μm; n=144; U=5341, p<0.001), mEmerald-fullTPX2 (median 4.77 μm; mean 13.96±1.77 μm; n=158; U=5390, p<0.001) and mEmerald-35TPX2 (median 56.53 μm; mean 71.96±4.27 μm; n=206; U=15697.5, p<0.001) (D) Data for each condition were positively skewed and graphed into a histogram. X-axis are binned neurite lengths, y-axis is frequency. Orange line denotes the mean.
Figure 4
Figure 4. Neurite length of TPX2-depleted neurons cannot be rescued TPX2 lacking kinesin-5 interacting domain
(A) Control or TPX2 siRNA was introduced into SCG neurons via nucleofection at the time of plating. After 2 DIV, neurons were re-plated and transfected with mEmerald control, mEmerald-fullTPX2 or mEmerald-shortTPX2 constructs for 24 h. Cells stained for β3-tubulin and expressing the constructs were quantified for neurite length. Bar 10 μm. (B) Mann-Whitney U test showed no significant difference between control siRNA mEmerald control (median 29.78 μm; mean 106.93±37.59 μm; n=21) and control siRNA mEmerald-fullTPX2 (median 14.67 μm; mean 43.88±15.49 μm; n=17; U=137.5, p=0.23) and control siRNA mEmerald-shortTPX2 (median 21.11 μm; mean 31.07±9.90 μm; n=17; U=126, p=0.13). Mann-Whitney U test showed significant difference between TPX2 siRNA mEmerald control (median 104.41 μm; mean 167.21±31.47 μm; n=41) and TPX2 siRNA mEmerald-fullTPX2 (median 25.57 μm; mean 59.86±17.87 μm; n=21; U=272, p=0.02), but no significant difference with TPX2 siRNA mEmerald-shortTPX2 (median 26.17 μm; mean 121.46±57.60 μm; n=16; U=225, p=0.07) (C) Schematic of TPX2 interaction with kinesin-5 and their effects on microtubules. (D) Data for each condition were positively skewed and graphed into a histogram. X-axis are binned neurite lengths, y-axis is frequency. Orange line denotes the mean.

References

    1. Baas PW, Black MM, Banker GA. Changes in microtubule polarity orientation during the development of hippocampal neurons in culture. J Cell Biol. 1989;109(6 Pt 1):3085–94. - PMC - PubMed
    1. Brunet S, Sardon T, Zimmerman T, Wittmann T, Pepperkok R, Karsenti E, Vernos I. Characterization of the TPX2 domains involved in microtubule nucleation and spindle assembly in Xenopus egg extracts. Mol Biol Cell. 2004;15(12):5318–28. - PMC - PubMed
    1. Ferenz NP, Gable A, Wadsworth P. Mitotic functions of kinesin-5. Semin Cell Dev Biol. 2010;21(3):255–9. - PMC - PubMed
    1. Ferhat L, Cook C, Chauviere M, Harper M, Kress M, Lyons GE, Baas PW. Expression of the mitotic motor protein Eg5 in postmitotic neurons: implications for neuronal development. J Neurosci. 1998;18(19):7822–35. - PMC - PubMed
    1. Giubettini M, Asteriti IA, Scrofani J, De Luca M, Lindon C, Lavia P, Guarguaglini G. Control of Aurora-A stability through interaction with TPX2. J Cell Sci. 2011;124(Pt 1):113–22. - PMC - PubMed

Publication types

LinkOut - more resources