. 2015 Aug 20;59(4):615-27.
doi: 10.1016/j.molcel.2015.07.003. Epub 2015 Aug 6.

Variable Glutamine-Rich Repeats Modulate Transcription Factor Activity

Affiliations

Variable Glutamine-Rich Repeats Modulate Transcription Factor Activity

Rita Gemayel et al. Mol Cell. .

Abstract

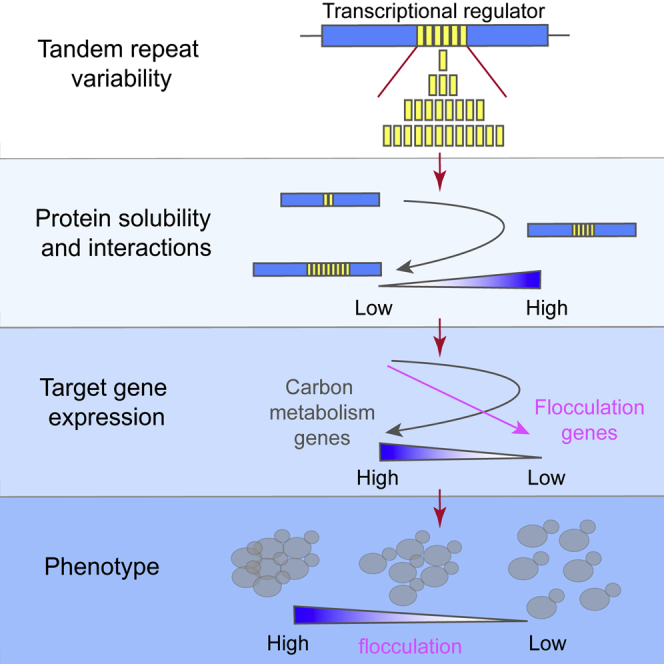
Excessive expansions of glutamine (Q)-rich repeats in various human proteins are known to result in severe neurodegenerative disorders such as Huntington's disease and several ataxias. However, the physiological role of these repeats and the consequences of more moderate repeat variation remain unknown. Here, we demonstrate that Q-rich domains are highly enriched in eukaryotic transcription factors where they act as functional modulators. Incremental changes in the number of repeats in the yeast transcriptional regulator Ssn6 (Cyc8) result in systematic, repeat-length-dependent variation in expression of target genes that result in direct phenotypic changes. The function of Ssn6 increases with its repeat number until a certain threshold where further expansion leads to aggregation. Quantitative proteomic analysis reveals that the Ssn6 repeats affect its solubility and interactions with Tup1 and other regulators. Thus, Q-rich repeats are dynamic functional domains that modulate a regulator's innate function, with the inherent risk of pathogenic repeat expansions.


Figures

None
Graphical abstract
Figure 1
Figure 1
Q-Rich TFs Influence Expression Variation of Targets across Different Timescales (A) Yeast TRN reconstructed based on data from Balaji et al. (2006) and Venters et al. (2011). For the latter, promoter occupancy cutoff of at least 3-fold higher than background was considered. Based on the presence of Q-rich repeats, the TFs and their targets were categorized. (B) Distribution of variation of expression among species and strains, across generations, and among genetically identical cells, of targets regulated by non-repeat containing TFs (NR-TFs) and TFs with Q-rich repeats (Q-rich TFs). The boxes represent the first and third quartile with the median at the black line. The notches correspond to ∼95% confidence interval for the median. The whiskers show data points up to 1.5 times the interquartile range. Statistical significance was assessed using Wilcoxon rank sum test. The effect sizes are represented by the common language effect size (CLES) statistic, describing the probability that a randomly selected target of Q-rich TFs will have higher expression variation than a randomly selected target of NR-TFs. (C) Influence of expression plasticity on gene-expression variability. Distribution of expression plasticity of NR-TF and Q-rich TF targets is shown. The panels represent the median of expression variation across different timescales of targets of NR-TFs and Q-rich TFs in low (bottom 33.3%), medium (middle 33.3%), and high (top 33.3%) expression plasticity bins defined using tertile cuts of the distribution of all genes. p values were estimated using Wilcoxon rank sum test. (D) Proposed model of target gene-expression variability over different time-scales facilitated by Q-rich TFs among genes with high dynamic expression modulation. (E) Enrichment of targets with expression variation across different timescales for each Q-rich TF. Enrichment of targets with expression variation values higher than that of median of all Q-rich TF targets was tested using a permutation test. In each permutation, every target of a Q-rich TF was replaced with a random target from the TRN. The number of random targets with expression variation values equal or higher than the median of Q-rich TF targets was noted for 10,000 iterations. The color intensity in the heatmap represents Z scores, which indicate the distance of the number of real targets to the mean of random expectation in SD units. Statistically significant enrichment is highlighted with a red border. p values were estimated as the ratio of the average number of random targets with expression variation more than or equal to that of Q-rich TF targets over the total number of random samples (10,000). See also Figures S1 and S2 and Tables S1 and S2.
Figure 2
Figure 2
The Q-Rich Repeats in Saccharomyces cerevisiae Transcriptional Regulator Ssn6 Show Variability between Natural Yeast Strains (A) Schematic representation of the Ssn6 protein showing the two repeat regions. TR1 denotes the N-terminal polyQ (residues 15 to 30), and TR2 denotes the central Q-rich repeat (residues 493 to 587). The natural range of repeat number variation is indicated underneath each repeat region. See also Figure S3. (B) The TR1 region of SSN6 from various S. cerevisiae strains was amplified by PCR. (C) Amplification of the SSN6 TR2 region from various S. cerevisiae strains. The asterisks denote genetically close strains YPS606 () and YPS128 (∗∗) with different TR2 sizes. See also Table S3. (D) TR sizes in representative SSN6 variants constructed for this study. Total repeat numbers are given. The asterisk indicates the repeat number in the WT strain. Repeat numbers falling within the range observed in natural strains (C) are indicated.
Figure 3
Figure 3
Whole-Genome Transcriptomics Reveal that Variation in the SSN6 TR2 Region Influences the Expression of Target Genes (A) Expression profiles for genes (rows) in different SSN6 TR2 variants (columns) in carbon-starved (left) or glucose-rich medium (right) measured by RNA-seq. The data are represented as relative to the expression levels in the WT (TR2-63), and similar colors indicate similar changes in expression relative to the WT strain. Enriched biological processes (Gene Ontology [GO] categories) of the target genes are shown (p < 0.05). Genes highlighted with arrows are key genes involved in alternative carbon transport and catabolism. The SUC2 gene that encodes the major sucrose-hydrolyzing enzyme is also highlighted. See also Figure S4 and Table S4. (B) Many genes showing SSN6 repeat-dependent variation in expression are known targets of Ssn6. The figure represents a functional network of all genes whose expression is affected by SSN6 TR2 variation, with edge colors representing different types of interactions. (C) Venn diagrams showing the overlap between genes whose expression is SSN6 TR2-dependent, genes with Ssn6-bound promoters (enrichment of 1.5-fold over background) (Venters et al., 2011) and genes showing de-repression upon TUP1 depletion from the nucleus (Wong and Struhl, 2011). The overlapping p values between our RNA-seq dataset and the other datasets were estimated by a chi-square test with Yates’ correction. (D) SSN6 TR2 variation confers environment-dependent changes in fitness. The correlation between fitness and SSN6 TR2 number was assessed by a linear regression test. Data points represent mean ± SD, n = 3.
Figure 4
Figure 4
Correlation between Ssn6 TR2-Dependent Variation in Target mRNA, Protein Levels, Expression Noise, and Associated Phenotypes (A) Mean mRNA levels, measured by RNA-seq are expressed as fold change relative to the WT (TR2-63 variant). Mean fluorescence of the corresponding reporter was measured by flow cytometry. Data points represent mean ± SEM, n = 5. See also Figure S5. (B) Analytical flow cytometry of single-cell fluorescence distributions of SSN6 target genes in the TR2 variants. A representative histogram for flo11::YFP (promoter fusion), IMA1-YFP, and CIN5-RFP (protein fusions) in each TR2 variant is shown. Expression noise (defined by the standard deviation divided by the mean fluorescence; i.e., magnitude of variability as a percentage of expression level) (Raser and O’Shea, 2004) was calculated from the fluorescence distributions. Data points represent mean ± SD, n = 5. (C) Images show flo11::YFP fluorescence in the SSN6 TR2 variants. Cells were analyzed by live-cell fluorescence and differential interference contrast (DIC) microscopy. (D) Adhesion to plastic and flocculation intensity correlate with FLO11 expression levels. Data points represent mean ± SD, n = 2. Colony morphologies of the SSN6 TR2 variants show a graded variation in complexity on YP-sucrose. The agar invading capacity is also TR2-length dependent. Cultures were spotted on YPD plates and pictures taken after 11 days of growth at 30°C (pre-wash). The plates were then washed under water to remove non-agar-invading cells (post-wash). Growth rates in palatinose correlate with IMA1 expression. Data points represent mean ± SD, n = 3.
Figure 5
Figure 5
TR2 Variation Modulates Ssn6 Solubility and Protein Interactions (A) Identification of Ssn6 interactors. Shared and unique interacting proteins between WT Ssn6 (TR2-63) and the repeat deletion (TR2-0) or expansion (TR2-105) forms are shown. Quantification is shown of enriched or depleted proteins in pull-downs of representative TR2 variants (labeled with 13C isotope, H) relative to the WT (TR2-63) (labeled with 12C isotope, L). Data points represent mean ± SD, n = 2. p values were evaluated using the unpaired two-tailed t test. Asterisks indicate p < 0.05. See also Table S5. (B) Co-localization of the Hsp70 chaperone Ssa2 and the expanded Ssn6 (TR2-105). Live cells of TR2 variants containing Ssn6-YFP and Ssa2-RFP fusion proteins were visualized by fluorescence and DIC microscopy. (C) Ssa2 maintains Ssn6 function. Analytical flow cytometry profiles of flo11::YFP in the TR2 variants and their Δssa2 counterparts show how deletion of SSA2 affects the expression of the FLO11 target gene. See also Figure S6. (D) Sequestration of expanded Ssn6 (TR2-105) in intranuclear foci (arrowheads) (left) and increased Ssn6 aggregation in the absence of Ssa2 (right). Live cells of TR2 variants containing Ssn6-YFP fusion and their Δssa2 counterparts were visualized by fluorescence and DIC microscopy. See also Figure S6. (E) The SSN6 TR2 region modulates Ssn6 solubility. Cultures of HA-tagged Ssn6 TR2 variants were analyzed by protein aggregation assay. Soluble and insoluble fractions of Ssn6 were quantified by western blot. For each variant, the ratio of the respective fraction over the sum of the soluble and insoluble fractions was calculated. The horizontal line indicates the mean of the insoluble fraction of the WT Ssn6 (TR2-63). Data represent mean ± SD, n = 3 or n = 2. p values were evaluated using the unpaired two-tailed t test. Asterisks indicate p < 0.05, ns, not significant. (F) Disruption of the Ssn6 TR2 conformation by proline insertions. Sequencing of the Ssn6 TR2 region show the replacement of two (mutant a) or three (mutants b and c) glutamine-alanine residues by prolines (red). (G) The α-helical coiled-coil structure of TR2 is essential for Ssn6 function. Median flo11::YFP fluorescence in the QA/P mutants (a, b, c) (striped bars) is comparable to the TR2-0 variant (green bar). Data points represent mean ± SD, n = 2.
Figure 6
Figure 6
Model for a Functional Role of Variable Q-Rich Repeats in the Transcriptional Regulator Ssn6 Variation in the number of Q-rich repeats in Ssn6 may primarily affect the Hsp70 (Ssa2)-mediated folding dynamics of this transcriptional regulator and its interaction with Tup1 and other regulators. The ensuing functional changes in Ssn6 result in repeat-length-dependent variation in the expression of genes involved in various cellular processes. These expression changes underlie phenotypic diversity (e.g., flocculation strength).

References

    1. Amberd D.C., Burke D., Strathern J.N. Cold Spring Harbor Laboratory Press; Cold Spring Harbor, NY: 2005. Methods in Yeast Genetics: A Cold Spring Harbor Laboratory Course Manual.
    1. Balaji S., Babu M.M., Iyer L.M., Luscombe N.M., Aravind L. Comprehensive analysis of combinatorial regulation using the transcriptional regulatory network of yeast. J. Mol. Biol. 2006;360:213–227. - PubMed
    1. Benson G. Tandem repeats finder: a program to analyze DNA sequences. Nucleic Acids Res. 1999;27:573–580. - PMC - PubMed
    1. Brown C.A., Murray A.W., Verstrepen K.J. Rapid expansion and functional divergence of subtelomeric gene families in yeasts. Curr. Biol. 2010;20:895–903. - PMC - PubMed
    1. Brückner S., Mösch H.U. Choosing the right lifestyle: adhesion and development in Saccharomyces cerevisiae. FEMS Microbiol. Rev. 2012;36:25–58. - PubMed

Publication types

MeSH terms