. 2015 Jul 24:9:257.
doi: 10.3389/fnins.2015.00257. eCollection 2015.

Boosting brain connectome classification accuracy in Alzheimer's disease using higher-order singular value decomposition

Affiliations

Boosting brain connectome classification accuracy in Alzheimer's disease using higher-order singular value decomposition

Liang Zhan et al. Front Neurosci. .

Abstract

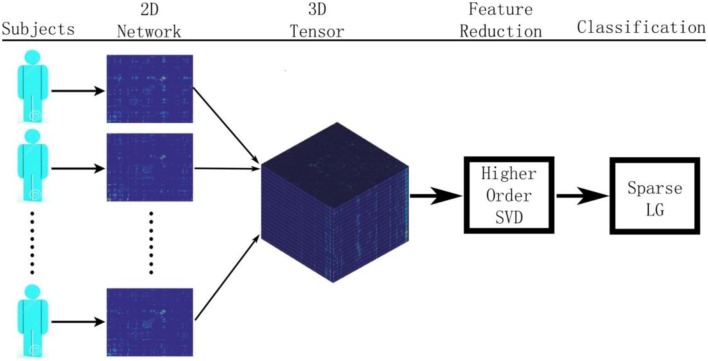
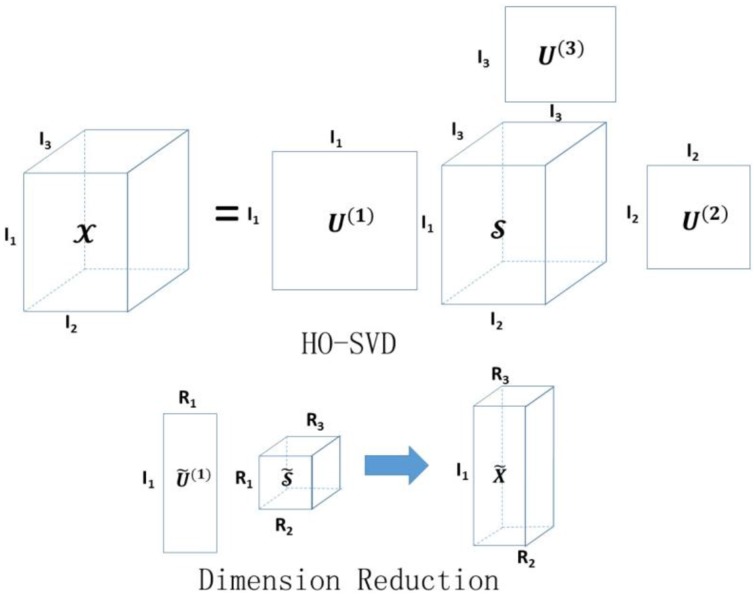
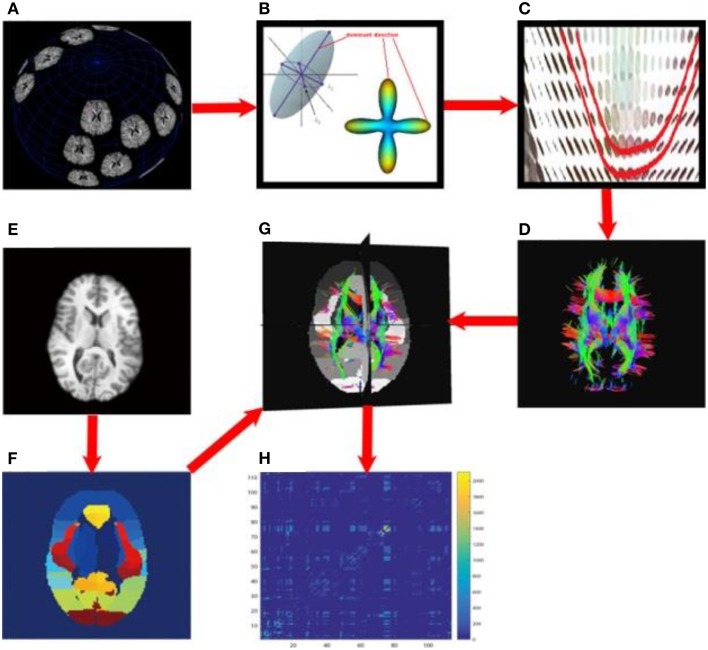
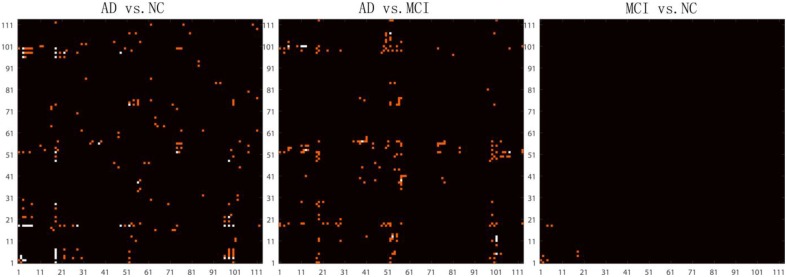
Alzheimer's disease (AD) is a progressive brain disease. Accurate detection of AD and its prodromal stage, mild cognitive impairment (MCI), are crucial. There is also a growing interest in identifying brain imaging biomarkers that help to automatically differentiate stages of Alzheimer's disease. Here, we focused on brain structural networks computed from diffusion MRI and proposed a new feature extraction and classification framework based on higher order singular value decomposition and sparse logistic regression. In tests on publicly available data from the Alzheimer's Disease Neuroimaging Initiative, our proposed framework showed promise in detecting brain network differences that help in classifying different stages of Alzheimer's disease.

Keywords: Alzheimer's disease; classification; connectome; diffusion MRI; high-order SVD; mild cognitive impairment.


Figures

Figure 1
Figure 1
Here we show the workflow used in this paper to classify patients based on their brain structural networks. We model brain networks as connectivity matrices, and then stack them up, across subjects, as a 3D tensor. We then perform feature reduction and use sparse methods for diagnostic classification.
Figure 2
Figure 2
Illustration of HO-SVD and corresponding feature reduction process. Please refer to Section HO-SVD for the meaning of all the letters.
Figure 3
Figure 3
Flowchart to compute structural brain networks. (A) Diffusion MRI: the MR signal was sampled after applying gradients in a set of directions uniformly distributed on a spherical surface; (B) Modeling: the diffusion process was modeled using a tensor model, or by fitting orientation distribution functions, and then the dominant direction was identified; (C) Fiber tracking: a fiber streamline was generated, connecting as far as possible the dominant directions of neighboring voxels under some constraints (e.g., a threshold on the maximum turning angle); (D) whole brain tractography, tracking fibers from a set of seeds across the whole brain; here, the color indicates the fiber directions, red for left and right, blue for superior and inferior, green for anterior and posterior; (E) T1-weighted brain MRI; (F) brain parcellation: here we defined 113 ROIs using the Harvard Oxford Cortical and Subcortical probabilistic atlas; (G) aligning the whole brain tractography and 113 ROIs; (H) the resulting un-normalized brain network, counting the number of detected fibers connecting each pair of ROIs.
Figure 4
Figure 4
Highlighted matrices showing Student t-test P maps for three diagnostic comparisons: left: AD vs. NC, middle: AD vs. MCI and right: MCI vs. NC are displayed. Each matrix is 113 × 113, corresponding to 113 ROI connectivity pattern. The ROIs are indexed from 1 to 113. Please refer to Zhan et al. (2013c) for corresponding numbers. Each cell of the GLM-adjusted network represents the connectivity, after removing the effects of age and sex at each element. The red points in these matrices highlight the location of uncorrected P < 0.001. Multiple comparisons were adjusted for by Bonferroni correction and the significance threshold was set to 7.9 × 10⁻⁶. The white points in these matrices highlight the location of the significant differences (after Bonferroni correction) in the network cell between the groups. The greatest number of connections were different when comparing controls and AD, but no connections survive Bonferroni correction when testing differences between controls and MCI.
Figure 5
Figure 5
−log10(P) values from our three inter-group comparisons using Student's t-test for each of five standard global network measures. From left to right, the five network measures are: MOD, modularity; MCC, mean clustering coefficient; CPL, characteristic path length; GLOB, global efficiency; and SW, small worldness, respectively. The colors indicate which groups are being compared: blue for AD vs. MCI, green for AD vs. NC, and yellow for MCI vs. NC. Bonferroni correction was used to account for multiple comparisons, so the adjusted threshold is 2, indicated by the red line in the figure. Only values above the line are statistically significant given this threshold. Our results show that only MCC can differentiate AD from MCI and only SW can differentiate AD from NC.

References

    1. Aganj I., Lenglet C., Jahanshad N., Yacoub E., Harel N., Thompson P. M., et al. . (2011). A Hough transform global probabilistic approach to multiple-subject diffusion MRI tractography. Med. Image Anal. 15, 414–425. 10.1016/j.media.2011.01.003 - DOI - PMC - PubMed
    1. Basser P. J., Pajevic S., Pierpaoli C., Duda J., Aldroubi A. (2000). In vivo fiber tractography using DT-MRI data. Magn. Reson. Med. 44, 625–632. 10.1002/1522-2594(200010)44:4<625::AID-MRM17>3.0.CO;2-O - DOI - PubMed
    1. Behrens T. E., Berg H. J., Jbabdi S., Rushworth M. F., Woolrich M. W. (2007). Probabilistic diffusion tractography with multiple fibre orientations: what can we gain? Neuroimage 34, 144–155. 10.1016/j.neuroimage.2006.09.018 - DOI - PMC - PubMed
    1. Bouwman F. H., van der Flier W. M., Schoonenboom N. S., van Elk E. J., Kok A., Rijmen F., et al. . (2007). Longitudinal changes of CSF biomarkers in memory clinic patients. Neurology 69, 1006–1011. 10.1212/01.wnl.0000271375.37131.04 - DOI - PubMed
    1. Burns A. (2009). Alzheimer's disease: on the verges of treatment and prevention. Lancet Neurol. 8, 4–5. 10.1016/S1474-4422(08)70271-0 - DOI - PubMed

LinkOut - more resources