

Combatting cyanobacteria with hydrogen peroxide: a laboratory study on the consequences for phytoplankton community and diversity
- PMID: 26257710
- PMCID: PMC4510418
- DOI: 10.3389/fmicb.2015.00714
Combatting cyanobacteria with hydrogen peroxide: a laboratory study on the consequences for phytoplankton community and diversity
Abstract
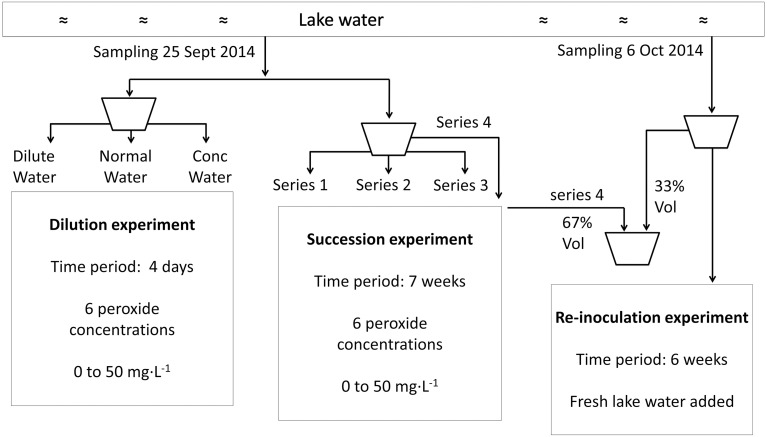
Experiments with different phytoplankton densities in lake samples showed that a high biomass increases the rate of hydrogen peroxide (HP) degradation and decreases the effectiveness of HP in the selective suppression of dominant cyanobacteria. However, selective application of HP requires usage of low doses only, accordingly this defines the limits for use in lake mitigation. To acquire insight into the impact of HP on other phytoplankton species, we have followed the succession of three phytoplankton groups in lake samples that were treated with different concentrations of HP using a taxa-specific fluorescence emission test. This fast assay reports relatively well on coarse changes in the phytoplankton community; the measured data and the counts from microscopical analysis of the phytoplankton matched quite well. The test was used to pursue HP application in a Planktothrix agardhii-dominated lake sample and displayed a promising shift in the phytoplankton community in only a few weeks. From a low-diversity community, a change to a status with a significantly higher diversity and increased abundance of eukaryotic phytoplankton species was established. Experiments in which treated samples were re-inoculated with original P. agardhii-rich lake water demonstrated prolonged suppression of cyanobacteria, and displayed a remarkable stability of the newly developed post-HP treatment state of the phytoplankton community.
Keywords: biodiversity; harmful cyanobacteria; hydrogen peroxide; lake mitigation; phytoplankton (Planktothrix agardhii).
Figures

 represents 2.5 mg·L−1;
  5 mg·L−1;
  10 mg·L−1;
  20 mg·L−1 and 50 mg·L−1 HP (all are the concentrations at time zero).
 4 h after HP addition;
  after 24 h and
  after 4 days.
 cyanobacteria;
  green algae plus diatoms.
 cyanobacteria;
  green algae and
  diatoms.
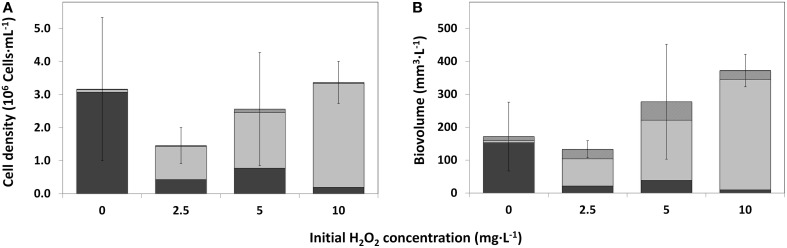
 cyanobacteria;
  green algae;
  diatoms and
  other taxa.
 represents 0 mg·L−1 HP (control); second bar
  2.5 mg·L−1; third bar
  5 mg·L−1 and the last bar
  10 mg·L−1.
 represents 0 mg·L−1 HP (control); second bar
  2.5 mg·L−1; third bar
  5 mg·L−1 and the last bar
  10 mg·L−1.
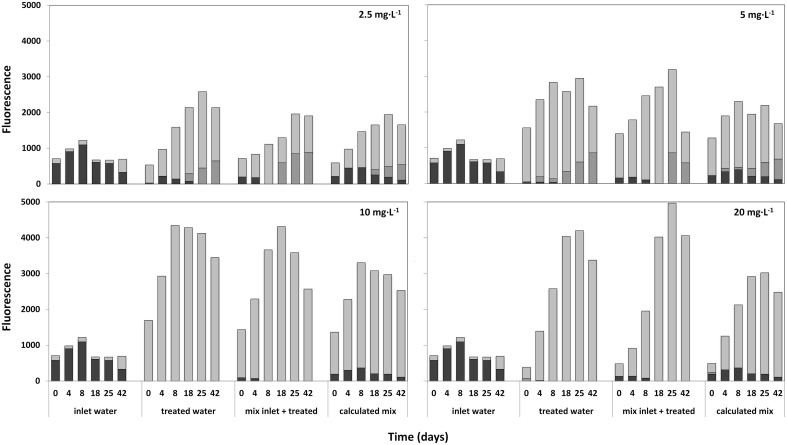
 cyanobacteria;
  green algae and
  diatoms.
References
-
- Ai Y., Bi Y. H., Hu Z. Y. (2015). Changes in phytoplankton communities along nutrient gradients in Lake Taihu: evidence for nutrient reduction strategies. Chin. J. Oceanol. Limn. 33, 447–457. 10.1007/s00343-015-4079-9 - DOI
-
- Akhurst D., Jones G. B., McConchie D. M. (2004). The application of sediment capping agents on phosphorus speciation and mobility in a sub-tropical dunal lake. Mar. Freshwat. Res. 55, 715–725. 10.1071/MF03181 - DOI
LinkOut - more resources
Full Text Sources
Other Literature Sources
Research Materials
Miscellaneous