

Study of a two species microbial community by an inferential comparative genomic analysis tool: Spatial Analytical Microbial Imaging
- PMID: 26258051
- PMCID: PMC4523904
- DOI: 10.1016/j.mex.2015.06.004
Study of a two species microbial community by an inferential comparative genomic analysis tool: Spatial Analytical Microbial Imaging
Abstract
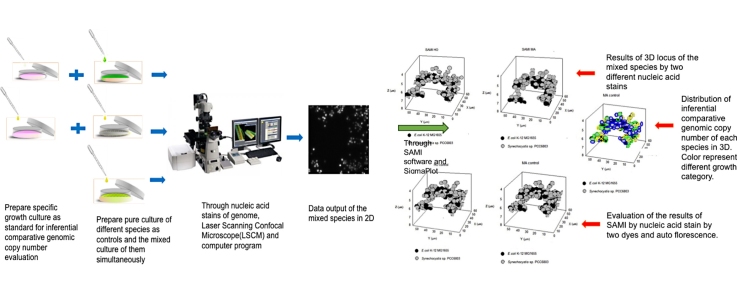
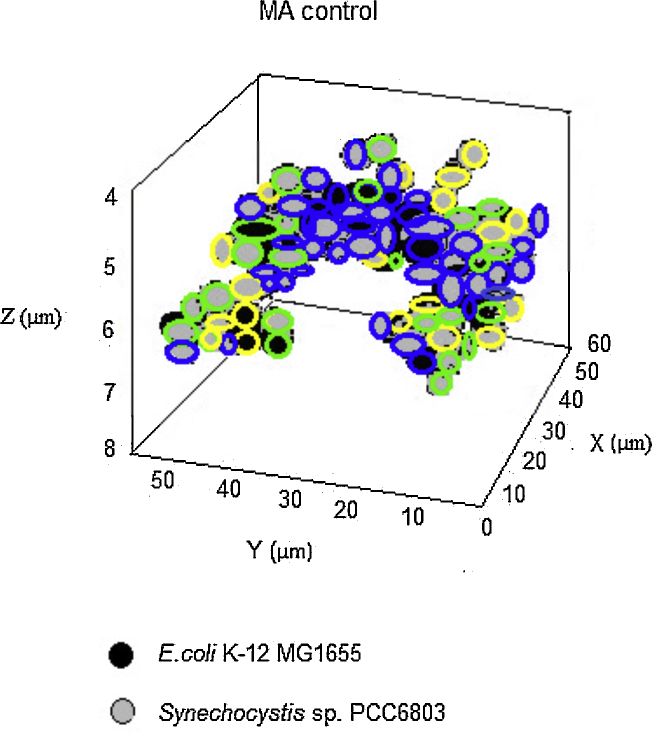
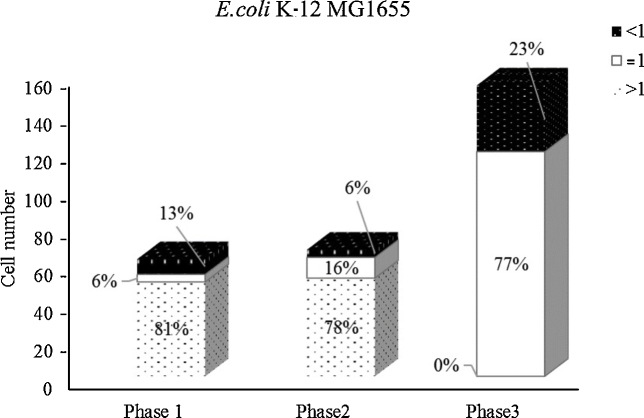
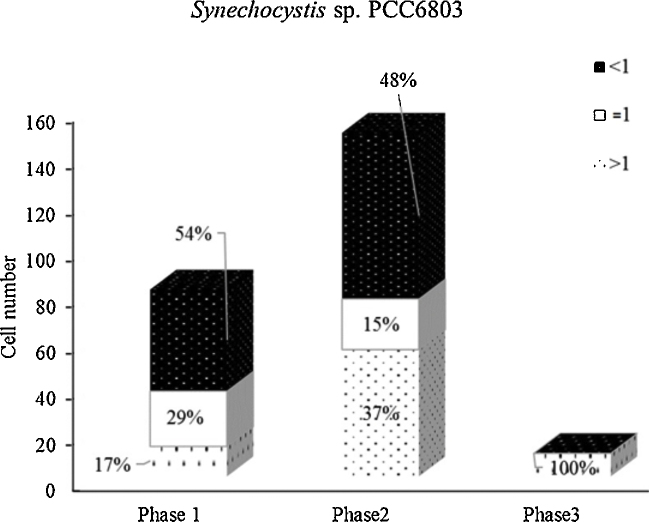
Most molecular fingerprinting techniques, including denaturing gradient gel electrophoresis (DGGE) [1], comparative genomic hybridization (CGH) [2], real-time polymerase chain reaction (RT-PCR) [3], destroy community structure and/or cellular integrity, therefore lost the info. of the spatial locus and the in situ genomic copy number of the cells. An alternative technique, fluorescence in situ hybridization (FISH) doesn't require sample disintegration but needs to develop specific markers and doesn't provide info. related to genomic copy number. Here, a microbial analysis tool, Spatial Analytical Microbial Imaging (SAMI), is described. An application was performed with a mixture of Synechocystis sp. PCC 6803 and E. coli K-12 MG1655. The intrinsic property of their genome, reflected by the average fluorescence intensity (AFI), distinguished them in 3D. And their growth rates were inferred by comparing the total genomic fluorescence binding area (GFA) with that of the pure culture standards. A 93% of accuracy in differentiating the species was achieved. •SAMI does not require sample disintegration and preserves the community spatial structure.•It measures the 3D locus of cells within the mixture and may differentiate them according to the property of their genome.•It allows assessment of the growth rate of the cells within the mixture by comparing their genomic copy number with that of the pure culture standards.
Keywords: 3D imaging analysis; 3D locus; Co-culture; Genomic copy number; Inferential comparative genomic copy number; Microbial community analysis; Spatial Analytical Microbial Imaging; Spatiotemporal microbial community.
Figures

Similar articles
-
Optimizing comparative genomic hybridization for analysis of DNA sequence copy number changes in solid tumors.Genes Chromosomes Cancer. 1994 Aug;10(4):231-43. doi: 10.1002/gcc.2870100403. Genes Chromosomes Cancer. 1994. PMID: 7522536 Review.
-
Combined array-comparative genomic hybridization and single-nucleotide polymorphism-loss of heterozygosity analysis reveals complex genetic alterations in cervical cancer.BMC Genomics. 2007 Feb 20;8:53. doi: 10.1186/1471-2164-8-53. BMC Genomics. 2007. PMID: 17311676 Free PMC article.
-
DGGE with genomic DNA: suitable for detection of numerically important organisms but not for identification of the most abundant organisms.Water Res. 2008 Dec;42(20):5002-10. doi: 10.1016/j.watres.2008.09.011. Epub 2008 Sep 30. Water Res. 2008. PMID: 18929384
-
High resolution analysis of DNA copy number variation using comparative genomic hybridization to microarrays.Nat Genet. 1998 Oct;20(2):207-11. doi: 10.1038/2524. Nat Genet. 1998. PMID: 9771718
-
[CGH (comparative genomic hybridization)].Nihon Rinsho. 1996 Apr;54(4):933-43. Nihon Rinsho. 1996. PMID: 8920653 Review. Japanese.
References
-
- Pinkel D., Segraves R., Sudar D., Clark S., Poole I., Kowbel D., Collins C., Kuo W.L., Chen C., Zhai Y., Dairkee S.H., Ljung B.M., Gray J.W., Albertson D.G. High resolution analysis of DNA copy number variation using comparative genomic hybridization to microarrays. Nat. Genet. 1998;20(October (2)):207–211. - PubMed
-
- Green M.R., Sambrook J. Cold Spring Harbor Laboratory Press; 2012. Molecular Cloning.
-
- Yah S.C., Eghafona N.O., Enabulele I.O., Aluyi H.S.A. Ampicillin usage and ampicillin resistant (Ampr) plasmids mediated Escherichia coli isolated from diarrheagenic patients attending some teaching hospital in Nigeria. Shiraz E-Med. J. 2006;7(4):1–12.
LinkOut - more resources
Full Text Sources
Other Literature Sources
