. 2015 Sep;33(9):933-40.
doi: 10.1038/nbt.3299. Epub 2015 Aug 10.

Prediction of human population responses to toxic compounds by a collaborative competition

Collaborators, Affiliations

Prediction of human population responses to toxic compounds by a collaborative competition

Federica Eduati et al. Nat Biotechnol. 2015 Sep.

Erratum in

  • Erratum: Prediction of human population responses to toxic compounds by a collaborative competition.
    Eduati F, Mangravite LM, Wang T, Tang H, Bare JC, Huang R, Norman T, Kellen M, Menden MP, Yang J, Zhan X, Zhong R, Xiao G, Xia M, Abdo N, Kosyk O; NIEHS-NCATS-UNC DREAM Toxicogenetics Collaboration; Friend S, Dearry A, Simeonov A, Tice RR, Rusyn I, Wright FA, Stolovitzky G, Xie Y, Saez-Rodriguez J. Eduati F, et al. Nat Biotechnol. 2015 Oct;33(10):1109. doi: 10.1038/nbt1015-1109a. Nat Biotechnol. 2015. PMID: 26448092 Free PMC article. No abstract available.

Abstract

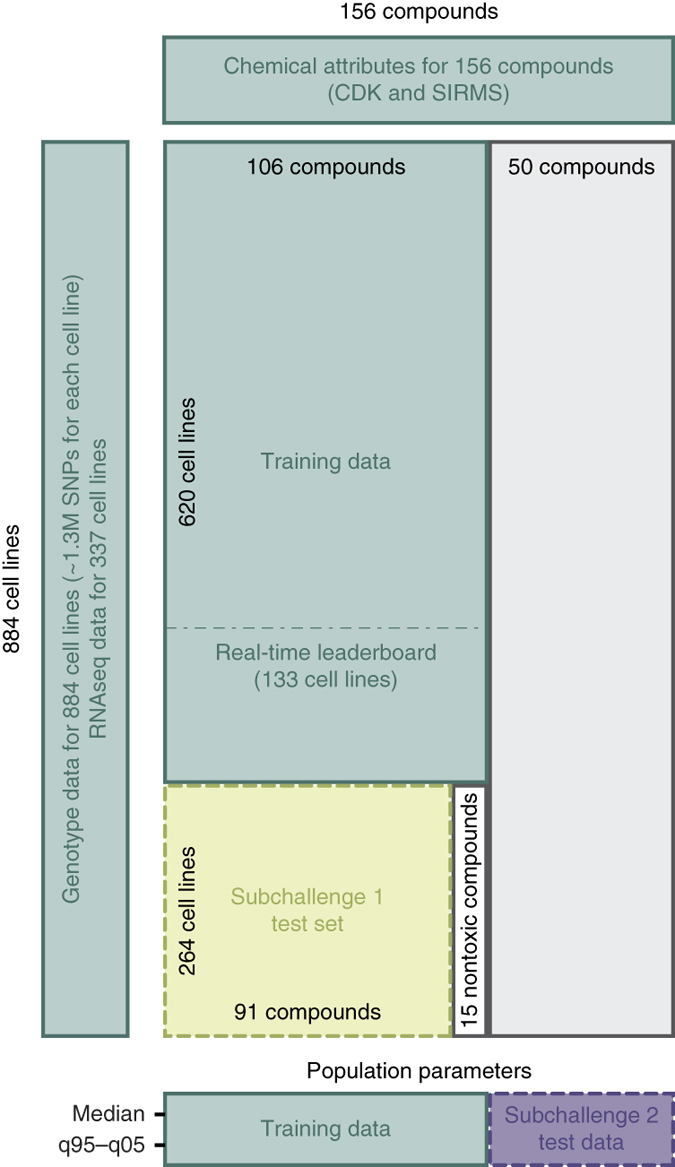
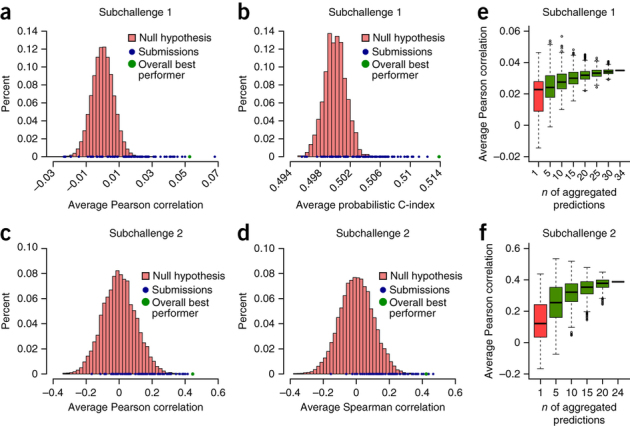
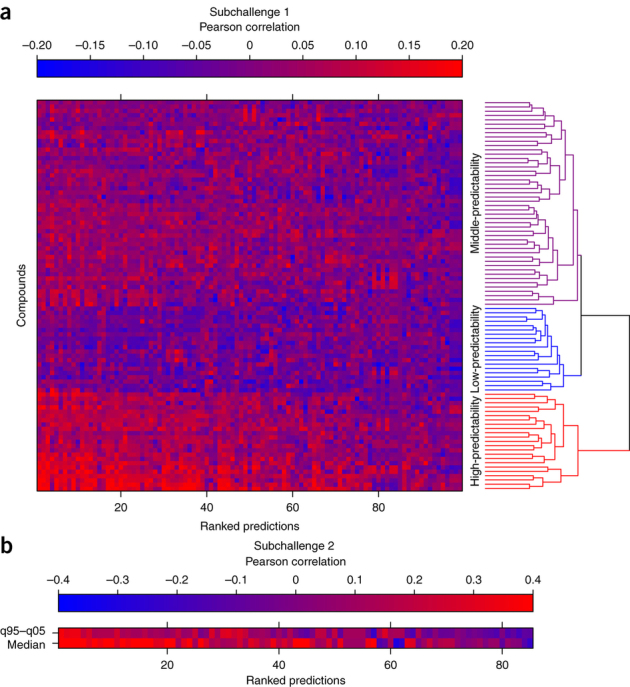
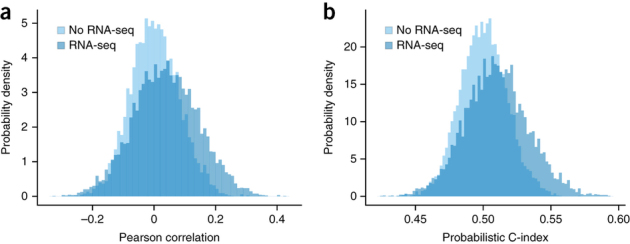
The ability to computationally predict the effects of toxic compounds on humans could help address the deficiencies of current chemical safety testing. Here, we report the results from a community-based DREAM challenge to predict toxicities of environmental compounds with potential adverse health effects for human populations. We measured the cytotoxicity of 156 compounds in 884 lymphoblastoid cell lines for which genotype and transcriptional data are available as part of the Tox21 1000 Genomes Project. The challenge participants developed algorithms to predict interindividual variability of toxic response from genomic profiles and population-level cytotoxicity data from structural attributes of the compounds. 179 submitted predictions were evaluated against an experimental data set to which participants were blinded. Individual cytotoxicity predictions were better than random, with modest correlations (Pearson's r < 0.28), consistent with complex trait genomic prediction. In contrast, predictions of population-level response to different compounds were higher (r < 0.66). The results highlight the possibility of predicting health risks associated with unknown compounds, although risk estimation accuracy remains suboptimal.


Conflict of interest statement

The authors declare no competing financial interests.

Figures

Figure 1
Figure 1. The NIEHS-NCATS-UNC DREAM Toxicogenetics Challenge overview.
The cytotoxicity data used in the challenge consist of the EC10 data generated for 884 lymphoblastoid cell line in response to 156 common environmental compounds. Participants were provided with a training set of cytotoxicity data for 620 cell lines and 106 compounds along with genotype data for all cell lines, RNA-seq data for 337 cell lines and chemical attributes for all compounds. The challenge was divided into two independent subchallenges: in subchallenge 1, participants were asked to predict EC10 values for a separate test set of 264 cell lines in response to the 106 compounds (only 91 toxic compounds were used for final scoring); in subchallenge 2, they were asked to predict population parameters (in terms of median EC10 values and 5th (q05) to 95th (q95) interquantile distance) for a separate test set of 50 compounds.
Figure 2
Figure 2. Significance of predictions.
(ad) Submissions are compared with the null hypothesis for subchallenge 1 (a,b) and subchallenge 2 (c,d). For each metric used for scoring (Pearson correlation (a) and pCi (b) for subchallenge 1, and Pearson correlation (c) and Spearman correlation (d) for subchallenge 2), performances shown for submissions are computed compound by compound and then averaged across compounds. The null hypothesis is generated for random predictions computed by random sampling, compound by compound, from the training set. (e,f) Performance of individual predictions (first boxplot, in red) is compared with performances of randomly aggregated predictions (wisdom of the crowds, in green) and with the aggregation of all predictions (last black bar). Performances are shown in terms of average Pearson correlation computed between predicted and measured values separately for each compound. Predictions were aggregated by averaging them. To aggregate only independent predictions, only one submission for each team was considered as the average of all predictions submitted by the team.
Figure 3
Figure 3. Performances of predictions.
(a,b) Predictions were compared to the gold standard based on Pearson correlation for subchallenge 1 (a) and subchallenge 2 (b). The heatmap in a illustrates performances of all predictions for all compounds used for evaluation; predictions are ranked as in the final leaderboard and compounds are clustered. Pearson correlation values are saturated at −0.2 and 0.2. The heatmap in b illustrates performances of all ranked predictions for predicted median and interquantile range (q95–q05).
Figure 4
Figure 4. Advantages of using RNA-seq data.
(a,b) Performances of predictions for cell lines for which RNA-seq data were available were compared against performances of predictions for cell lines for which RNA-seq data were not available. Pearson correlation and pCi were computed for each compound; the comparison shows that predictions for cell lines for which RNA-seq data were available are significantly better (paired t-test, P << 10−10). All predictions are included in the analysis regardless of the actual use of the RNA-seq data.
Figure 5
Figure 5. Best performing method subchallenge 1 and subchallenge 2.
The prediction procedure of the best performing team of subchallenge 1. (a) Workflow of prediction for subchallenge 1. (b) Heatmap of number of cell lines in each category of “genetic cluster” (1–10, x axis) and geographic subpopulation (y axis). (c) Modeling workflow used by team QBRC for Toxicogenetics Challenge subchallenge 2. The model starts from deriving potential toxicity-related features by comparing response data and chemical descriptor profiles (step 1) and classifying compounds based on their toxicity responses (step 2). Then, group-specific models are built based on group-specific chemical features and the entire training set (step 3). Finally, the toxicity of a new compound is calculated as a weighted average of the predicted toxicities from each group-specific model (step 4). (d) In step 3, differentially distributed features and all training samples are used to develop group-specific models. (e) In step 4, model applicability domain and the similarities between the new compound and the compound group are used to determine the weights for each group-specific model.
Figure 6
Figure 6. Overview of methods and data used to solve the challenges.
Overview of the input data, data reduction techniques, prediction algorithms and model validation techniques used by participants to solve the challenge. Participants were asked to fill out a survey in order to be included in this publication as part of the NIEHS-NCATS-UNC Dream Toxicogenetics challenge consortium; only data for teams that filled out the survey are shown here. Each row corresponds to a submission, and they are ordered based on the final rank for subchallenge 1 and subchallenge 2, respectively. Data originate from 75 filled-out surveys for subchallenge 1 (of 99 submissions) and 51 filled-out surveys for subchallenge 2 (of 80 submissions). This corresponds to 21 (of 34) teams for subchallenge 1 and 12 (of 23) for subchallenge 2.

References

    1. Judson R, et al. The toxicity data landscape for environmental chemicals. Environ. Health Perspect. 2009;117:685–695. doi: 10.1289/ehp.0800168. - DOI - PMC - PubMed
    1. Jacobs AC, Hatfield KP. History of chronic toxicity and animal carcinogenicity studies for pharmaceuticals. Vet. Pathol. 2013;50:324–333. doi: 10.1177/0300985812450727. - DOI - PubMed
    1. Zeise L, et al. Addressing human variability in next-generation human health risk assessments of environmental chemicals. Environ. Health Perspect. 2013;121:23–31. doi: 10.1289/ehp.1205687. - DOI - PMC - PubMed
    1. Dorne JLCM. Metabolism, variability and risk assessment. Toxicology. 2010;268:156–164. doi: 10.1016/j.tox.2009.11.004. - DOI - PubMed
    1. Abdo N, et al. Population-based in vitro hazard and concentration-response assessment of chemicals: the 1000 Genomes high-throughput screening Study. Environ. Health Perspect. 2015;123:458–466. doi: 10.1289/ehp.1408775. - DOI - PMC - PubMed

Publication types

Substances

LinkOut - more resources