

High Intensity Interval Training Improves Glycaemic Control and Pancreatic β Cell Function of Type 2 Diabetes Patients
- PMID: 26258597
- PMCID: PMC4530878
- DOI: 10.1371/journal.pone.0133286
High Intensity Interval Training Improves Glycaemic Control and Pancreatic β Cell Function of Type 2 Diabetes Patients
Abstract
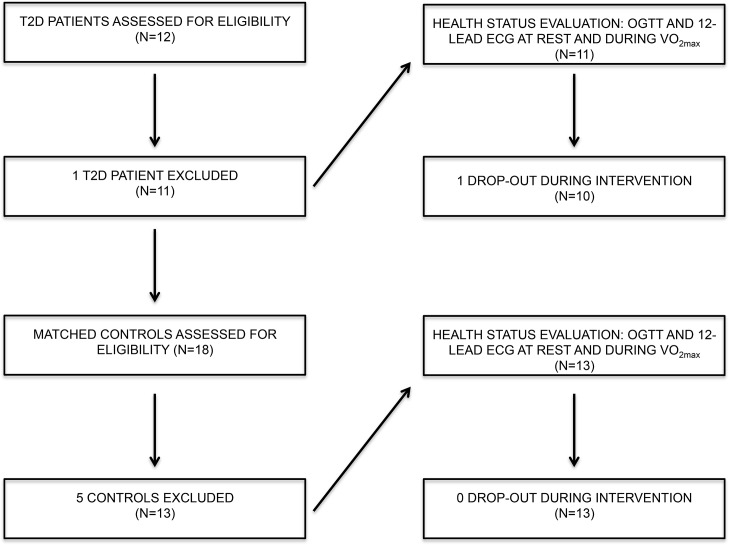
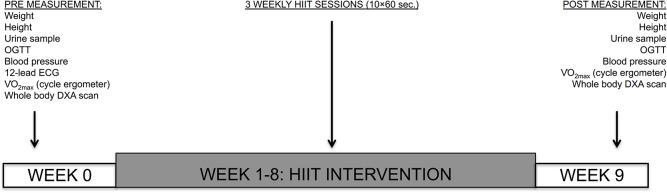
Physical activity improves the regulation of glucose homeostasis in both type 2 diabetes (T2D) patients and healthy individuals, but the effect on pancreatic β cell function is unknown. We investigated glycaemic control, pancreatic function and total fat mass before and after 8 weeks of low volume high intensity interval training (HIIT) on cycle ergometer in T2D patients and matched healthy control individuals. Study design/method: Elderly (56 yrs±2), non-active T2D patients (n = 10) and matched (52 yrs±2) healthy controls (CON) (n = 13) exercised 3 times (10×60 sec. HIIT) a week over an 8 week period on a cycle ergometer. Participants underwent a 2-hour oral glucose tolerance test (OGTT). On a separate day, resting blood pressure measurement was conducted followed by an incremental maximal oxygen uptake (VO2max) cycle ergometer test. Finally, a whole body dual X-ray absorptiometry (DXA) was performed. After 8 weeks of training, the same measurements were performed. Results: in the T2D-group, glycaemic control as determined by average fasting venous glucose concentration (p = 0.01), end point 2-hour OGTT (p = 0.04) and glycosylated haemoglobin (p = 0.04) were significantly reduced. Pancreatic homeostasis as determined by homeostatic model assessment of insulin resistance (HOMA-IR) and HOMA β cell function (HOMA-%β) were both significantly ameliorated (p = 0.03 and p = 0.03, respectively). Whole body insulin sensitivity as determined by the disposition index (DI) was significantly increased (p = 0.03). During OGTT, the glucose continuum was significantly reduced at -15 (p = 0.03), 30 (p = 0.03) and 120 min (p = 0.03) and at -10 (p = 0.003) and 0 min (p = 0.003) with an additional improvement (p = 0.03) of its 1st phase (30 min) area under curve (AUC). Significant abdominal fat mass losses were seen in both groups (T2D: p = 0.004 and CON: p = 0.02) corresponding to a percentage change of -17.84%±5.02 and -9.66%±3.07, respectively. Conclusion: these results demonstrate that HIIT improves overall glycaemic control and pancreatic β cell function in T2D patients. Additionally, both groups experienced abdominal fat mass losses. These findings demonstrate that HIIT is a health beneficial exercise strategy in T2D patients.
Trial registration: ClinicalTrials.gov NCT02333734 http://clinicaltrials.gov/ct2/show/NCT02333734.
Conflict of interest statement
Figures


Similar articles
-
Exercise training decreases pancreatic fat content and improves beta cell function regardless of baseline glucose tolerance: a randomised controlled trial.Diabetologia. 2018 Aug;61(8):1817-1828. doi: 10.1007/s00125-018-4627-x. Epub 2018 May 2. Diabetologia. 2018. PMID: 29717337 Free PMC article. Clinical Trial.
-
The effects of a 2 week modified high intensity interval training program on the homeostatic model of insulin resistance (HOMA-IR) in adults with type 2 diabetes.J Sports Med Phys Fitness. 2014 Apr;54(2):203-9. J Sports Med Phys Fitness. 2014. PMID: 24509992
-
Diets along with interval training regimes improves inflammatory & anti-inflammatory condition in obesity with type 2 diabetes subjects.J Diabetes Metab Disord. 2018 Nov 28;17(2):253-267. doi: 10.1007/s40200-018-0368-0. eCollection 2018 Dec. J Diabetes Metab Disord. 2018. PMID: 30918861 Free PMC article.
-
Impaired "Glycine"-mia in Type 2 Diabetes and Potential Mechanisms Contributing to Glucose Homeostasis.Endocrinology. 2017 May 1;158(5):1064-1073. doi: 10.1210/en.2017-00148. Endocrinology. 2017. PMID: 28323968 Review.
-
Cardioprotective Effect of High Intensity Interval Training and Nitric Oxide Metabolites (NO2 (-), NO3 (-)).Iran J Public Health. 2015 Sep;44(9):1270-6. Iran J Public Health. 2015. PMID: 26587502 Free PMC article. Review.
Cited by
-
Discontinuation of HIIT restores diabesity while retraining increases gut microbiota diversity.iScience. 2024 Jun 24;27(8):110365. doi: 10.1016/j.isci.2024.110365. eCollection 2024 Aug 16. iScience. 2024. PMID: 39175767 Free PMC article.
-
Moderate-Intensity Exercise and High-Intensity Interval Training Affect Insulin Sensitivity Similarly in Obese Adults.J Clin Endocrinol Metab. 2020 Aug 1;105(8):e2941-59. doi: 10.1210/clinem/dgaa345. J Clin Endocrinol Metab. 2020. PMID: 32492705 Free PMC article. Clinical Trial.
-
β-Cell function during a high-fat meal in young versus old adults: role of exercise.Am J Physiol Regul Integr Comp Physiol. 2023 Aug 1;325(2):R164-R171. doi: 10.1152/ajpregu.00047.2023. Epub 2023 Jun 12. Am J Physiol Regul Integr Comp Physiol. 2023. PMID: 37306399 Free PMC article. Clinical Trial.
-
High-intensity interval training: a review of its impact on glucose control and cardiometabolic health.Diabetologia. 2017 Jan;60(1):7-23. doi: 10.1007/s00125-016-4106-1. Epub 2016 Sep 28. Diabetologia. 2017. PMID: 27681241 Free PMC article. Review.
-
High-Intensity Interval Training for Individuals With Isolated Impaired Fasting Glucose: Protocol for a Proof-of-Concept Randomized Controlled Trial.JMIR Res Protoc. 2025 Feb 20;14:e59842. doi: 10.2196/59842. JMIR Res Protoc. 2025. PMID: 39977858 Free PMC article.
References
-
- Unger RH. Glucagon physiology and pathophysiology. N Engl J Med 1971. August 19;285(8):443–449. - PubMed
-
- Pan XR, Li GW, Hu YH, Wang JX, Yang WY, An ZX, et al. Effects of diet and exercise in preventing NIDDM in people with impaired glucose tolerance. The Da Qing IGT and Diabetes Study. Diabetes Care 1997. April;20(4):537–544. - PubMed
-
- Tuomilehto J, Lindstrom J, Eriksson JG, Valle TT, Hamalainen H, Ilanne-Parikka P, et al. Prevention of type 2 diabetes mellitus by changes in lifestyle among subjects with impaired glucose tolerance. N Engl J Med 2001. May 3;344(18):1343–1350. - PubMed
-
- Lindstrom J, Louheranta A, Mannelin M, Rastas M, Salminen V, Eriksson J, et al. The Finnish Diabetes Prevention Study (DPS): Lifestyle intervention and 3-year results on diet and physical activity. Diabetes Care 2003. December;26(12):3230–3236. - PubMed
