Limitations to oxygen transport and utilization during sprint exercise in humans: evidence for a functional reserve in muscle O2 diffusing capacity
- PMID: 26258623
- PMCID: PMC4606532
- DOI: 10.1113/JP270408
Limitations to oxygen transport and utilization during sprint exercise in humans: evidence for a functional reserve in muscle O2 diffusing capacity
Abstract
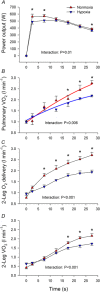
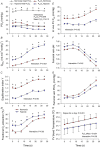
To determine the contribution of convective and diffusive limitations to V̇(O2peak) during exercise in humans, oxygen transport and haemodynamics were measured in 11 men (22 ± 2 years) during incremental (IE) and 30 s all-out cycling sprints (Wingate test, WgT), in normoxia (Nx, P(IO2): 143 mmHg) and hypoxia (Hyp, P(IO2): 73 mmHg). Carboxyhaemoglobin (COHb) was increased to 6-7% before both WgTs to left-shift the oxyhaemoglobin dissociation curve. Leg V̇(O2) was measured by the Fick method and leg blood flow (BF) with thermodilution, and muscle O2 diffusing capacity (D(MO2)) was calculated. In the WgT mean power output, leg BF, leg O2 delivery and leg V̇(O2) were 7, 5, 28 and 23% lower in Hyp than Nx (P < 0.05); however, peak WgT D(MO2) was higher in Hyp (51.5 ± 9.7) than Nx (20.5 ± 3.0 ml min(-1) mmHg(-1), P < 0.05). Despite a similar P(aO2) (33.3 ± 2.4 and 34.1 ± 3.3 mmHg), mean capillary P(O2) (16.7 ± 1.2 and 17.1 ± 1.6 mmHg), and peak perfusion during IE and WgT in Hyp, D(MO2) and leg V̇(O2) were 12 and 14% higher, respectively, during WgT than IE in Hyp (both P < 0.05). D(MO2) was insensitive to COHb (COHb: 0.7 vs. 7%, in IE Hyp and WgT Hyp). At exhaustion, the Y equilibration index was well above 1.0 in both conditions, reflecting greater convective than diffusive limitation to the O2 transfer in both Nx and Hyp. In conclusion, muscle V̇(O2) during sprint exercise is not limited by O2 delivery, O2 offloading from haemoglobin or structure-dependent diffusion constraints in the skeletal muscle. These findings reveal a remarkable functional reserve in muscle O2 diffusing capacity.
© 2015 The Authors. The Journal of Physiology © 2015 The Physiological Society.
Figures


References
-
- Amann M & Kayser B (2009). Nervous system function during exercise in hypoxia. High Alt Med Biol 10, 149–164. - PubMed
-
- Arbogast S, Vassilakopoulos T, Darques JL, Duvauchelle JB & Jammes Y (2000). Influence of oxygen supply on activation of group IV muscle afferents after low‐frequency muscle stimulation. Muscle Nerve 23, 1187–1193. - PubMed
-
- Arnold S (2012). Cytochrome c oxidase and its role in neurodegeneration and neuroprotection. Adv Exp Med Biol 748, 305–339. - PubMed
-
- Bangsbo J, Krustrup P, Gonzalez‐Alonso J, Boushel R & Saltin B (2000). Muscle oxygen kinetics at onset of intense dynamic exercise in humans. Am J Physiol Regul Integr Comp Physiol 279, R899–906. - PubMed
Publication types
MeSH terms
LinkOut - more resources
Full Text Sources
Medical
Miscellaneous

