. 2015 Sep;22(9):686-694.
doi: 10.1038/nsmb.3070. Epub 2015 Aug 10.

Probing Gαi1 protein activation at single-amino acid resolution

Affiliations

Probing Gαi1 protein activation at single-amino acid resolution

Dawei Sun et al. Nat Struct Mol Biol. 2015 Sep.

Abstract

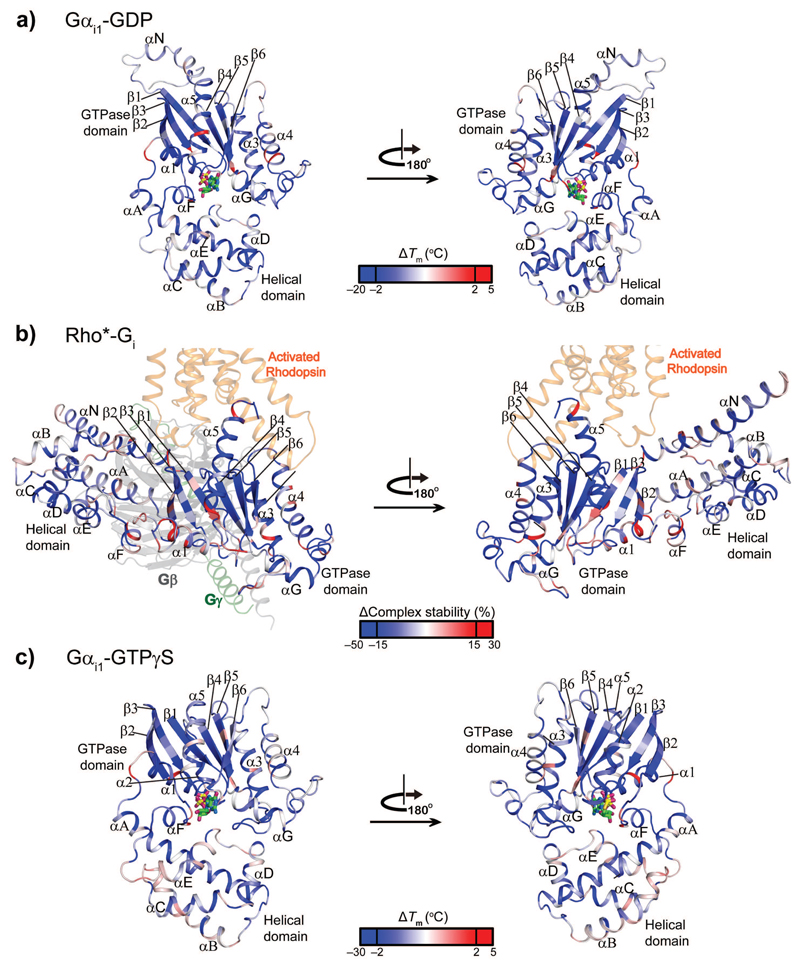
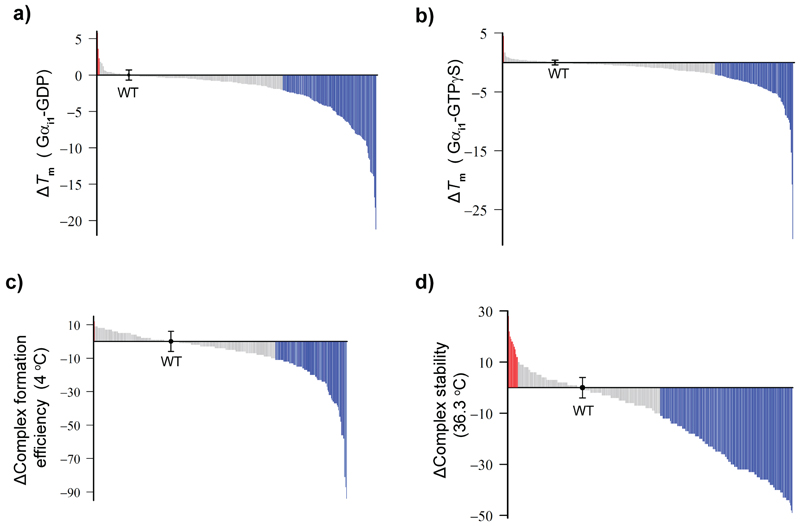
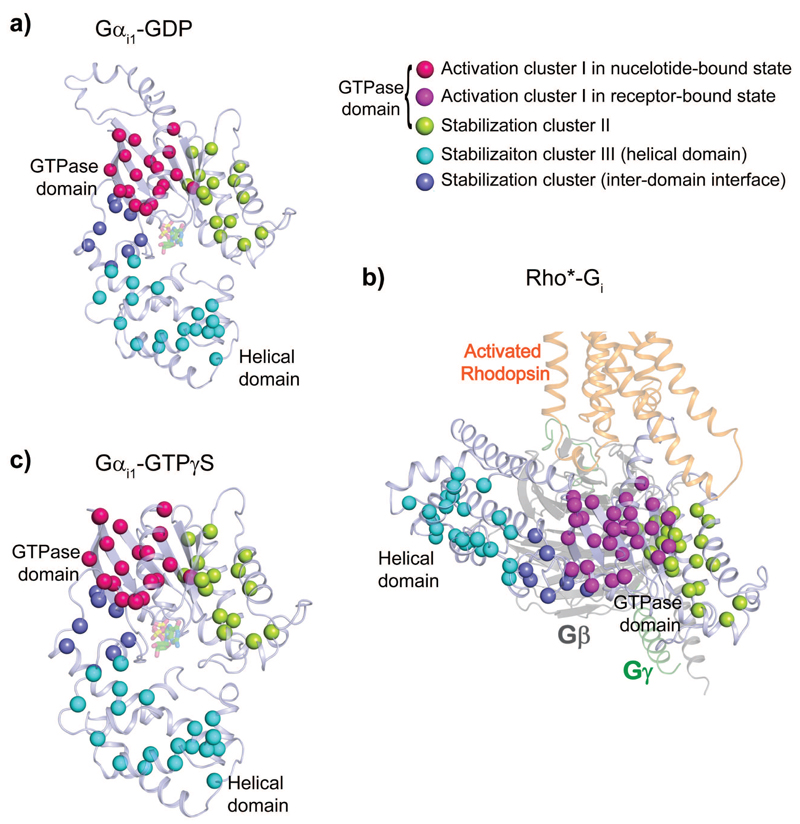
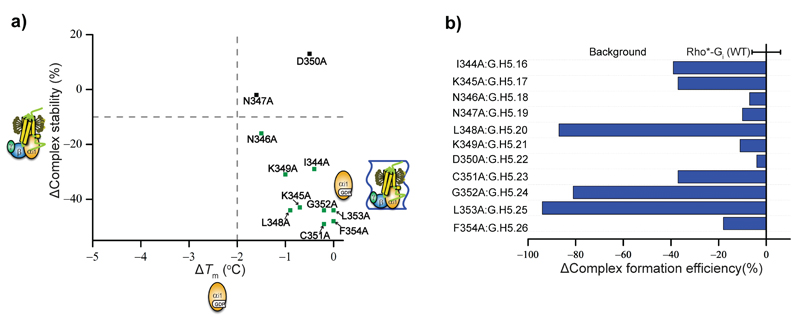
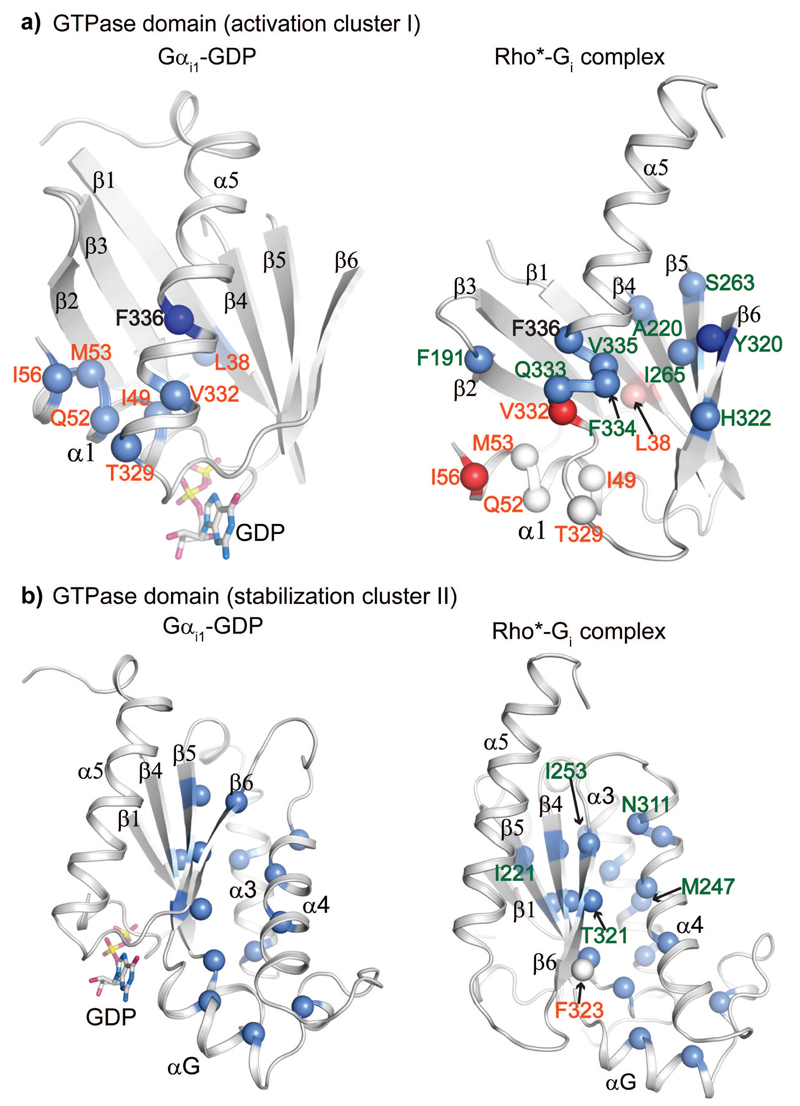
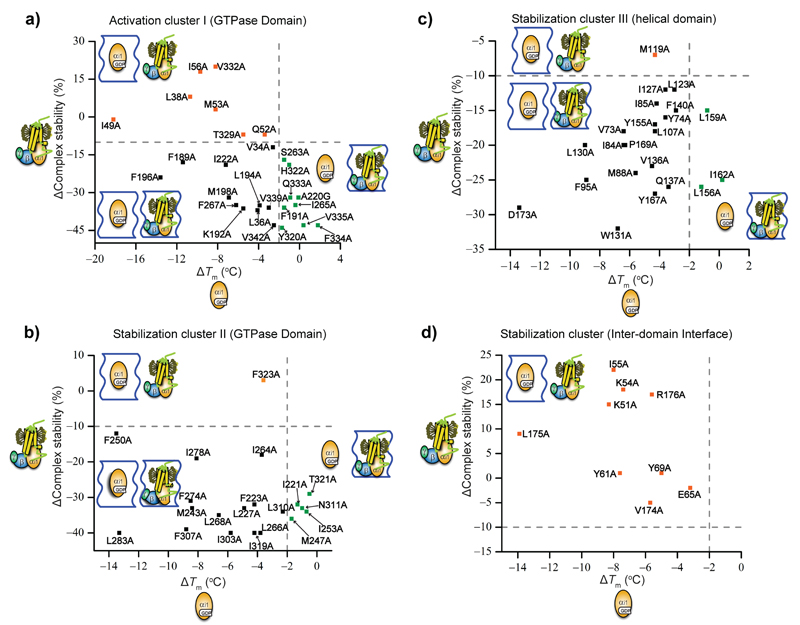
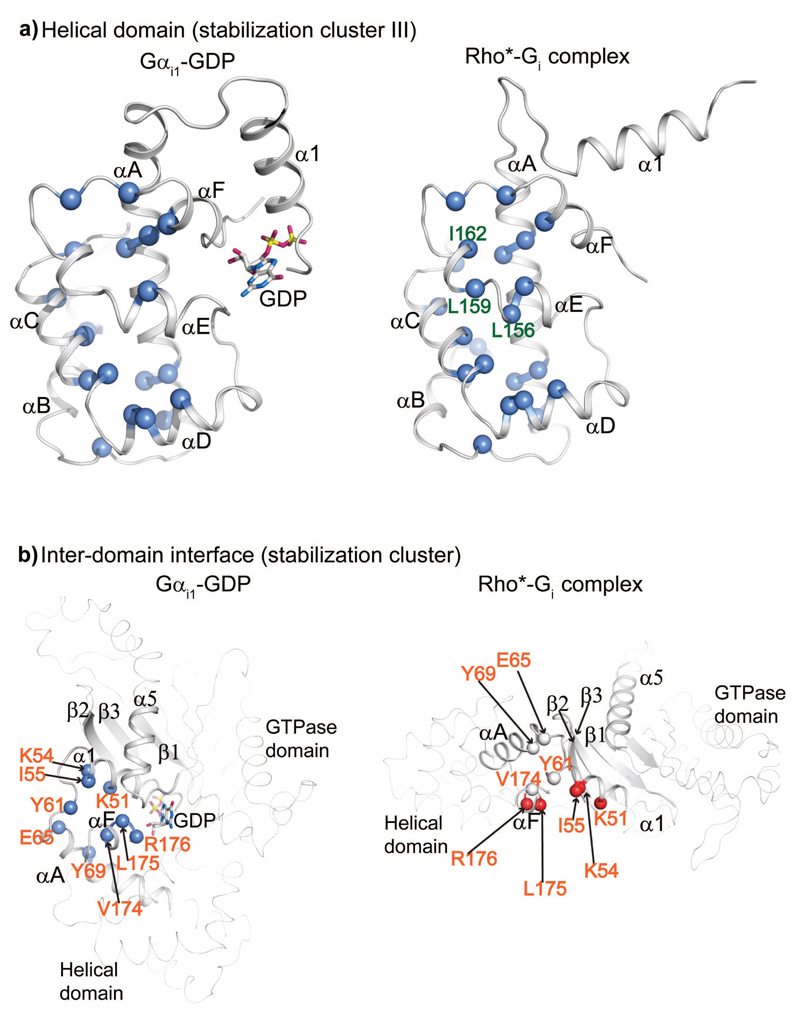
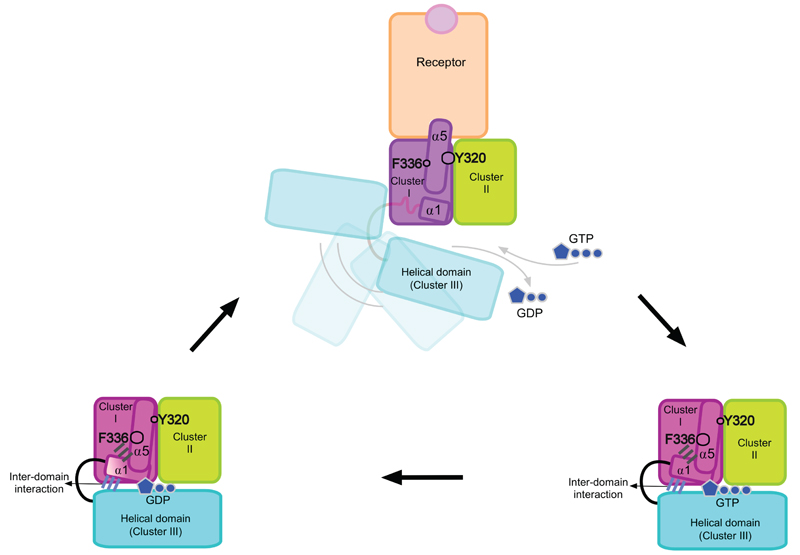
We present comprehensive maps at single-amino acid resolution of the residues stabilizing the human Gαi1 subunit in nucleotide- and receptor-bound states. We generated these maps by measuring the effects of alanine mutations on the stability of Gαi1 and the rhodopsin-Gαi1 complex. We identified stabilization clusters in the GTPase and helical domains responsible for structural integrity and the conformational changes associated with activation. In activation cluster I, helices α1 and α5 pack against strands β1-β3 to stabilize the nucleotide-bound states. In the receptor-bound state, these interactions are replaced by interactions between α5 and strands β4-β6. Key residues in this cluster are Y320, which is crucial for the stabilization of the receptor-bound state, and F336, which stabilizes nucleotide-bound states. Destabilization of helix α1, caused by rearrangement of this activation cluster, leads to the weakening of the interdomain interface and release of GDP.


Figures

Figure 1
Figure 1. Stability effects of Gαi1 alanine mutants on the nucleotide-bound and receptor-bound states.
a-c, Effects of alanine substitutions in Gαi1 on stability of the (a) GDP-, (b) receptor- and (c) GTPγS–bound states. In the GDP- (a)and GTPγS-bound (b) states, the ∆Tm values for each single alanine mutant are mapped onto the crystal structure of GDP-bound Gαi1 (PDB 1GDD11) and GTPγS-bound Gαi1 (PDB 1GIA10), as a spectrum ranging from blue over white to red. In the receptor-bound state (b), the change in the complex stability (∆complex stability) is mapped onto the homology model of Rho*-Gi complex (see supplementary methods) as spectrum ranging from blue over white to red. Rhodopsin is shown in orange. β and γ subunits are displayed in grey and forest green, respectively. GDP and GTPγS are shown as sticks. The view of GTPase domain of Gαi1 in the complex-bound state is the same as in the GDP- and GTP-bound state, while the helical domain is significantly displaced relative to the GTPase domain in the receptor-bound state.
Figure 2
Figure 2. Distribution of effects of Gαi1 alanine mutants on the nucleotide-bound and receptor-bound states.
a, b, Changes in stability (∆Tm) of Gαi1(Ala)-GDP (w/ 1mM GDP) (a) and ∆Tm of Gαi1(Ala)-GTPγS (w/ 0.1mM GTPγS) (b). Gray: -2°C < ∆Tm < 2°C; blue: ∆Tm < -2°C; red: 2°C < ∆Tm. The ∆Tm of Gαi1(WT)-GDP or -GTPγS was shown as the black dot. c, Distribution of ∆ complex formation efficiency of Rho*-Gi(Ala). Blue: ∆ complex formation efficiency is less than -10%; gray: between -10% and 10%; red: more than 10%. d, Distribution of ∆complex stability of Rho*-Gi(Ala). Blue: ∆complex stability is less than -10%; gray: between -10% and 10%; red: more than 10%. The definition of ∆Tm, ∆complex formation efficiency, and ∆complex stability are described in the methods section. All data are presented in Supplementary Table 1. As for ∆Tm of Gαi1 (WT)-GDP and Gαi1(Ala)-GTPγS, data points represent mean ± s.d. from 25 and 24 individual experiments, respectively. As for ∆complex formation efficiency and ∆complex stability of Rho*-Gi(WT), data points represent mean ± s.d. of 33 and 38 individual experiments, respectively.
Figure 3
Figure 3. Stabilization clusters in the GTPase, helical domain and the inter-domain interface in the nucleotide- and receptor-bound states.
a-c, Identified stabilization clusters derived from stability effects of Gαi1 alanine mutants on GDP- (a), receptor- (b) and GTPγS-bound (c) states. The identified activation cluster I and stabilization cluster II in the GTPase domain, the stabilization cluster III in the helical domain, and the stabilization cluster in the inter-domain interface are shown as spheres and mapped to GDP-bound Gαi1 state (PDB 1GDD 11) (a), homology model of Rho*-Gi complex state (b) and GTPγS-bound Gαi1 state (PDB 1GIA 10) (c). The stabilization cluster II, III and the stabilization cluster in the inter-domain interface are coloured in lemon, cyan and slate blue spheres in all three states, respectively. The activation cluster I is displayed as hot pink spheres in nucleotide-bound state (a, c), and as magenta spheres in the receptor-bound state (b) to indicate its conformational change upon coupling to the receptor. The relative orientation of the GTPase domain is identical in all states, while the helical domain is displaced in the receptor-bound state.
Figure 4
Figure 4. Effect on the nucleotide-bound and receptor-bound states of alanine mutation of the last 11 amino acids of Gαi1.
a, Effect on the thermal stability of the GDP-bound and receptor-bound states of alanine mutation of the last 11 resides of the C-terminus of Gαi1. The CGN of the labelled residues is listed in Supplementary Table 1. b, Effect on Rho*-Gi complex formation of alanine mutation of the last 11 resides of the C-terminus of Gαi1. The increase in ∆complex formation efficiency is coloured in red and the decrease is coloured in blue. The definition of ∆Tm, ∆ complex formation efficiency, and ∆complex stability are provided in the supplementary methods and the derived numbers are shown in Supplementary Table 1. Data points represent mean ± s.d. of 33 individual experiments.
Figure 5
Figure 5. Close-up view of activation cluster I and stabilization cluster II.
a-b, Residues involved in the activation cluster I (a) and the stabilization cluster II (b) of the GTPase domain in GDP-bound and receptor-bound states. The involved residues are shown as spheres in both the GDP-bound and receptor-bound states. Light blue: destabilizing effect by mutation to alanine; white: stability comparable to WT after mutation to alanine; light red: stabilizing effect due to mutation to alanine. Residues labelled in orange: alanine mutations dramatically destabilize the GDP-bound state but not the receptor-bound state; residues labelled in forest green: alanine mutations do not affect the GDP-bound state, but significantly destabilize the receptor-bound state; residues without lableing: alanine mutation destablizie both GDP- and receptor-bound state. I56AG.H1.11 and V332AG.H5.4 (shown in red) significantly stabilize the complex. The alanine mutation of F336G.H5.8 completely impairs the stability of the GDP-bound state (shown in deep blue). The alanine mutation of Y320G.S6.2 severely impairs the complex formation (shown in deep blue). The CGN of the labelled residues is listed in Supplementary Table 1.
Figure 6
Figure 6. Stability effect of alanine mutation of the residues involved in the activation and stabilization clusters.
a-d, Effect on stability of mutation of the residues involved in the activation cluster I (a), stabilization clusters II (b) and III (c), and the inter-domain interface (d) on the GDP- and receptor-bound states. Orange: mutations that dramatically destabilize the GDP-bound state, but do not affect the stability of receptor-bound state; forest green: mutations that do not destabilize the GDP-bound state, but significantly destabilize the receptor-bound state; black: mutation that destabilize both nucleotide- and receptor-bound states. The alanine mutants represented by the orange and the forest green box correspond to the colour of residue number shown in Fig. 5a-b and Fig. 7a-b. The blue wavy box cartoons represent the nucleotide- or receptor-bound states affected by mutations.
Figure 7
Figure 7. Close-up view of stabilization cluster III and stabilization cluster in the inter-domain interface.
a-b, Reisudes invloved in stabilization clusters in the helical domain (a) and inter-domain interface (b) in GDP-bound and receptor-bound states. The involved residues are shown as spheres in both the GDP-bound and the receptor-bound states. Light blue: destabilising effect by mutation to alanine; white: stability comparable to WT after mutation to alanine; light red: stabilization after mutation to alanine. Residues labelled in orange: alanine mutations dramatically destabilize the GDP-bound state but not the receptor-bound state; residues labelled in forest green: alanine mutations do not affect the GDP-bound state, but significantly destabilize the receptor-bound state; residues without lableing: alanine mutation destabilize both GDP- and receptor-bound state.
Figure 8
Figure 8. Nucleotide exchange in the Gαi1 subunit mediated by the activation and stabilization clusters.
Cluster I is coloured in hot pink in both the GDP- and GTP-bound states, and in magenta in the receptor-bound state. Cluster II and III are coloured in lemon and cyan in the three states, respectively. The inter-domain interaction and the interactions between helices α1 and α5 are coloured in slate blue and grey, respectively. GDP and GTP are shown in dark blue. Cluster I consists of helices α1 and α5 packed against stands β1-3 in the nucleotide-bound states. In the receptor-bound state, these interactions are weakened and compensated by new interactions between helix α5 and stands β4-6. The most prominent examples of the residues involved in this rearrangement are Y320G.S6.2, which is crucial for the stabilization of the receptor bound state, and F336G.H5.8, important for the stability of the GDP- and GTP-bound states. Destabilization of helix α1 results in weakening of the inter-domain interface, separation of the helical domain from the GTPase domain and release of GDP.

References

    1. Gilman AG. G proteins: transducers of receptor-generated signals. Annu Rev Biochem. 1987;56:615–49. - PubMed
    1. Wall MA, et al. The structure of the G protein heterotrimer Gi alpha 1 beta 1 gamma 2. Cell. 1995;83:1047–58. - PubMed
    1. Sprang SR. G proteins, effectors and GAPs: structure and mechanism. Curr Opin Struct Biol. 1997;7:849–56. - PubMed
    1. Oldham WM, Van Eps N, Preininger AM, Hubbell WL, Hamm HE. Mechanism of the receptor-catalyzed activation of heterotrimeric G proteins. Nature structural & molecular biology. 2006;13:772–7. - PubMed
    1. Oldham WM, Hamm HE. Heterotrimeric G protein activation by G-protein-coupled receptors. Nat Rev Mol Cell Biol. 2007 - PubMed

Publication types