. 2015 Sep;47(9):1091-8.
doi: 10.1038/ng.3367. Epub 2015 Aug 10.

A gene-based association method for mapping traits using reference transcriptome data

Affiliations

A gene-based association method for mapping traits using reference transcriptome data

Eric R Gamazon et al. Nat Genet. 2015 Sep.

Abstract

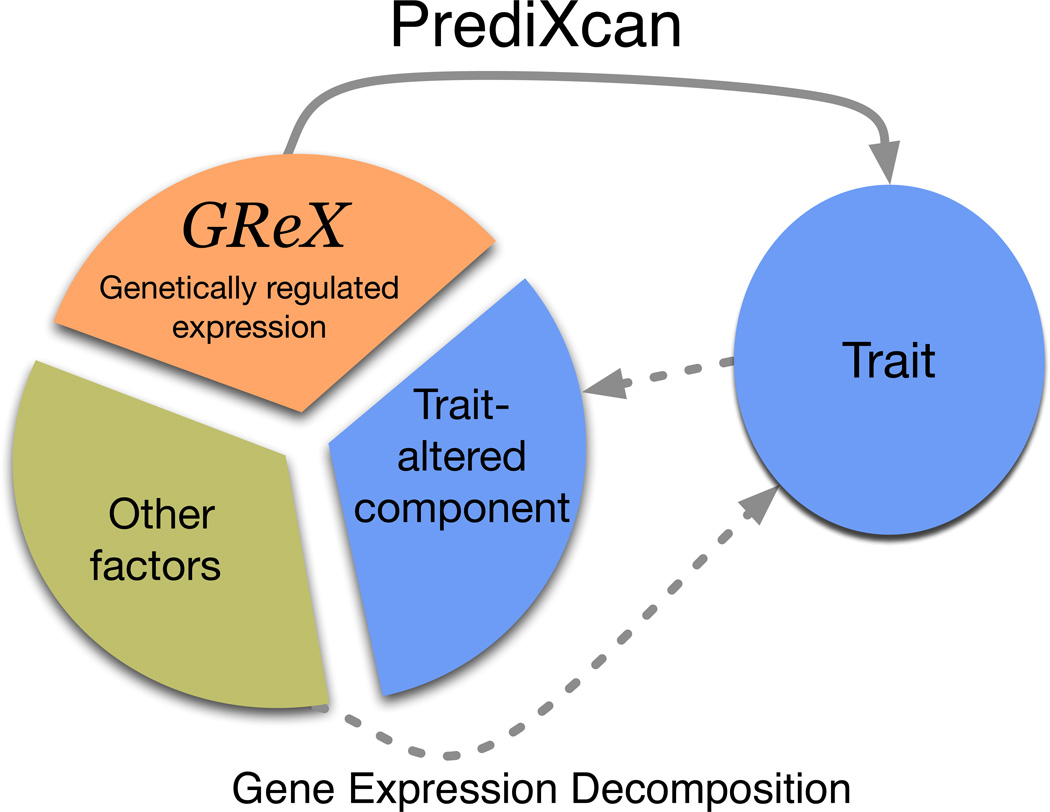
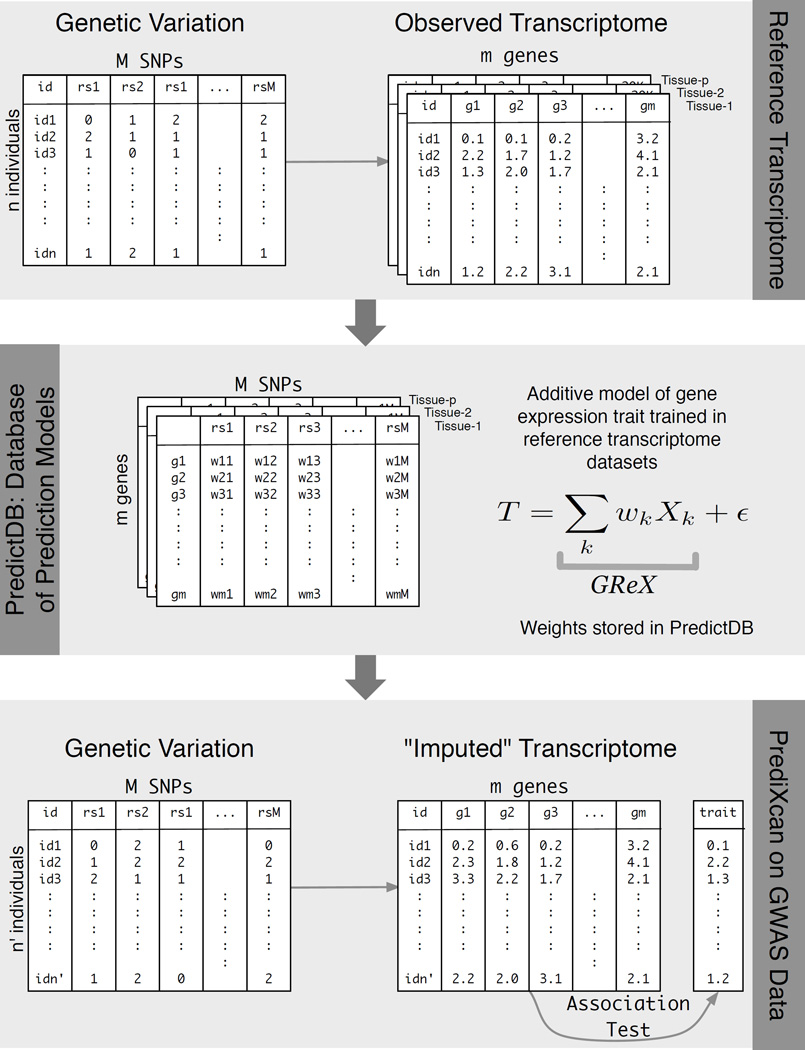
Genome-wide association studies (GWAS) have identified thousands of variants robustly associated with complex traits. However, the biological mechanisms underlying these associations are, in general, not well understood. We propose a gene-based association method called PrediXcan that directly tests the molecular mechanisms through which genetic variation affects phenotype. The approach estimates the component of gene expression determined by an individual's genetic profile and correlates 'imputed' gene expression with the phenotype under investigation to identify genes involved in the etiology of the phenotype. Genetically regulated gene expression is estimated using whole-genome tissue-dependent prediction models trained with reference transcriptome data sets. PrediXcan enjoys the benefits of gene-based approaches such as reduced multiple-testing burden and a principled approach to the design of follow-up experiments. Our results demonstrate that PrediXcan can detect known and new genes associated with disease traits and provide insights into the mechanism of these associations.


Figures

Figure 1
Figure 1. Mechanism tested by the PrediXcan method
This figure shows the conceptual decomposition of the expression level of a gene into three components: genetically determined component, a component altered by the trait itself, and the remaining factors (including environment). PrediXcan estimates the genetically regulated component of expression (GReX) and correlates it with the trait to identify trait-associated genes.
Figure 2
Figure 2. PrediXcan framework
The workflow illustrates the steps used in developing the PrediXcan method. The top panel shows the data used from the reference transcriptome studies: genotype and expression levels (GTEx, GEUVADIS, DGN, etc). The sample size of the study is denoted by n, m is the number of genes considered, M is the total number of SNPs, and p is the number of available tissues. The second panel shows the additive model used to build a database of prediction models, PredictDB. T represents the expression trait, and Xk is the number of reference alleles for SNP k. The coefficients of the models for each tissue are fitted using the reference transcriptome datasets and optimal statistical learning methods chosen among LASSO, Elastic Net, OmicKriging, etc. The bottom panel shows the application of PrediXcan to a GWAS dataset. Using genetic variation data from the GWAS and weights in PredictDB, we “impute” expression levels for the whole transcriptome. These imputed levels are correlated with the trait using regression (e.g., linear, logistic, Cox) or non-parametric (Spearman) approaches. (For the disease phenotypes in the WTCCC datasets and the replication dataset reported here, we used logistic regression with disease status.)
Figure 3
Figure 3. Cross-validated prediction performance vs heritability
This figure shows the prediction performance (R2 of GReX vs. observed expression in red) compared to gene expression heritability estimates (black with 95% confidence interval in gray). Performance was assessed using 10-fold cross-validation in the DGN whole blood cohort (n=922) with the elastic net, polygenic score (p < 1×10⁻⁴), and using the top SNP for prediction.
Figure 4
Figure 4. Prediction performance of elastic net tested on a separate cohort
Using whole blood prediction models trained in DGN, we compared predicted levels of expression with observed levels on lymphoblastoid cell lines from the 1000 Genomes project. RNA-sequenced data (n=421) on these cell lines have been made publicly available by the GEUVADIS consortium. Left panel shows the squared correlation, R2, between predicted and observed levels plotted against the null distribution of R2 Right panel shows prediction performance (R2 of GReX vs. observed expression in green) compared to GEUVADIS gene expression heritability (h2) estimates (black with 95% confidence interval in gray).
Figure 5
Figure 5. Examples of well-predicted genes
These plots show observed vs. predicted levels of 4 genes. Predicted levels were computed using whole blood elastic net prediction models trained in DGN data. Observed levels were RNA-seq data in lymphoblastoid cell lines generated by the GEUVADIS consortium.
Figure 6
Figure 6. PrediXcan results for type 1 diabetes
Complete results for our analysis of type 1 diabetes from the WTCCC using gene expression predicted with the DGN whole blood predictors. Panel (a) shows association p-values based on gene position across the genome. Panel (b) shows the same results plotted against the null expectation in a q–q plot. The red line in panel (b) shows the null expected distribution of p-values. In panels (a) and (b), the blue line represents the bonferroni corrected genome-wide significance threshold. The top 3 genes are labeled. Panel (c) shows the results of our GWAS enrichment analysis. The histogram shows the expected number of genes with a p-value < 0.01 based on 10,000 random permutations. The large point shows the observed number of previously known T1D genes that fall below this threshold.
Figure 7
Figure 7. Comparison of gene-based methods
Q-Q plot showing distribution of p-values derived from each method (VEGAS, SKAT, and PrediXcan) for genes outside of the HLA region for Rheumatoid Arthritis.

References

    1. Spencer CC, Su Z, Donnelly P, Marchini J. Designing genome-wide association studies: sample size, power, imputation, and the choice of genotyping chip. PLoS Genet. 2009;5:e1000477. - PMC - PubMed
    1. Speliotes EK, et al. Association analyses of 249,796 individuals reveal 18 new loci associated with body mass index. Nat Genet. 2010;42:937–948. - PMC - PubMed
    1. Manolio TA, et al. Finding the missing heritability of complex diseases. Nature. 2009;461:747–753. - PMC - PubMed
    1. Perera MA, et al. The missing association: sequencing-based discovery of novel SNPs in VKORC1 and CYP2C9 that affect warfarin dose in African Americans. Clin Pharmacol Ther. 2011;89:408–415. - PMC - PubMed
    1. Ritchie MD. The success of pharmacogenomics in moving genetic association studies from bench to bedside: study design and implementation of precision medicine in the post-GWAS era. Hum Genet. 2012;131:1615–1626. - PMC - PubMed

Publication types