. 2015 Dec;98(5):831-46.
doi: 10.1111/mmi.13160. Epub 2015 Sep 10.

Expression of the Helicobacter pylori virulence factor vacuolating cytotoxin A (vacA) is influenced by a potential stem-loop structure in the 5' untranslated region of the transcript

Affiliations

Expression of the Helicobacter pylori virulence factor vacuolating cytotoxin A (vacA) is influenced by a potential stem-loop structure in the 5' untranslated region of the transcript

Karin R Amilon et al. Mol Microbiol. 2015 Dec.

Abstract

The vacuolating cytotoxin, VacA, is an important virulence factor secreted by the gastric pathogen Helicobacter pylori. Certain vacA genotypes are strongly associated with disease risk, but the association is not absolute. The factors determining vacA gene expression are not fully understood, and the mechanisms of its regulation are elusive. We have identified a potential mRNA stem-loop forming structure in the 5' untranslated region (UTR) of the vacA transcript. Using site-directed mutagenesis, we found that disruption of the stem-loop structure reduced steady-state mRNA levels between two- and sixfold (P = 0.0005) and decreased mRNA half-life compared with wild type (P = 0.03). This led to a marked reduction in VacA protein levels and overall toxin activity. Additionally, during stressful environmental conditions of acid pH or high environmental salt concentrations, when general transcription of vacA was decreased or increased respectively, the stabilising effects of the stem-loop were even more pronounced. Our results suggest that the stem-loop structure in the vacA 5' UTR is an important determinant of vacA expression through stabilisation of the vacA mRNA transcript and that the stabilising effect is of particular importance during conditions of environmental stress.


Figures

Figure 1
Figure 1
Nucleotide sequences and prevalence of 20 different stem‐loop variants in 67 clinical H . pylori isolates. A. The +4 to +30 nucleotide stem‐loop DNA sequences from 67 clinical H . pylori isolates were aligned. The upstream‐, loop‐ and downstream stem are marked by red, green and blue lines respectively. Positions of common polymorphisms are indicated by numbered arrows. The prevalence of each variant is indicated by the number of strains in the right hand column. The ability of the mRNA to form a stem‐loop structure at the +4 to +30 position is indicated by Y (yes) and N (no). The asterisk denotes minor variation in the stem of the +4 to +30 structure. The strain lacking a stem‐loop at position +4 to +30 was predicted to form a small alternative stem‐loop at position +7 to +19. The predicted minimum free energy (ΔG°) values for each structure, determined using the online Fold RNAstructure webserver (Reuter and Mathews, 2010) for each variant are also indicated (NA = not applicable). For comparison, the equivalent stem‐loop sequences in four commonly used reference strains of H . pylori are also included. These are represented among the clinical varieties as well. B. Alignment of each stem‐loop variant (position +1 to +34) subjected to consensus secondary structure analysis by the Freiburg Tools online webserver LocARNA (Smith et al., 2010). Nucleotide conservation is indicated by colour, see guide in (C). C. Consensus secondary structure of stem‐loop variants, generated by the Freiburg Tools online webserver LocARNA (Smith et al., 2010). Circled nucleotides indicate positions were base substitutions have occurred but base pairing has been maintained (consistent mutations). Grey lettering represents sites where base changes have disrupted base pairing and the colour coding reflects the number of base pairing types at that position and the number of incompatible base changes as given in the colour legend.
Figure 2
Figure 2
H . pylori 60190 wild type and stem‐loop mutants. A. DNA sequence alignment of H . pylori 60190 wild type and mutant strains. The inverted stem‐loop forming structure is marked by coloured boxes: red for the upstream side of the stem, green for the loop and blue for the downstream side. The −10 region (Pribnow box) and the transcriptional start point (TSP) are also indicated. B. Schematic representation of vac A mRNA 5′ UTR stem‐loop structure in (i) 60190 (wild type), (ii) 60190::SLdis, (iii) 60190::SLmir and (iv) 60190::SLGtoA. Mutational changes are shown in grey. Binding strength between pairing nucleotides is indicated by = (strong), – (relatively strong) and · (relatively weak). The predicted minimum free energy values for each mutant structure, determined using the online Fold RNAstructure webserver (Reuter and Mathews, 2010), are indicated below the schematic representations.
Figure 3
Figure 3
Steady‐state vac A mRNA levels in H . pylori stem‐loop mutants. Growth from 24 hour BA‐plates was used to inoculate 10 ml F12 Ham medium (supplemented with 10% FCS and 1% L‐glutamine). Cultures were incubated for 30 min in a microaerobic workstation with shaking at 200 r.p.m., after which samples were collected. RNA was extracted and used as template for cDNA synthesis using reverse transcriptase. RT‐qPCR was then used to determine expression of vac A mRNA relative to 16s rRNA expression for wild type and mutant strains in (A) H . pylori 60190 and (B) H . pyloriSS1. A standard preparation of cDNA from the 60190::pCTB2cat strain was used as the comparator in all RT‐qPCR assays. The graphs show the mean (+ SD) vac A mRNA level of at least four independent experiments. A one‐way ANOVA with Tukey's multiple comparison was used for statistical analysis. NS = not statistically significant.
Figure 4
Figure 4
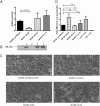
VacA protein levels in H . pylori 60190 stem‐loop mutants. A. Relative VacA protein quantity in extracts from the 60190 wild type and stem‐loop mutants, determined by densitometry readings from three independent western blots probed with a mixture of rabbit polyclonal anti‐VacA p33 and p55 subunits and horseradish peroxidase‐conjugated goat anti‐rabbit secondary antibody, visualised using chemiluminescence. B. An example western blot, lane 1 = 60190::pCTB2cat, 2 = 60190::SLdis, 3 = 60190::SLmir, 4 = 60190::SLGtoA. C. Vacuolation of RK13 cells incubated with protein extracts of the H . pylori 60190 vac A stem‐loop mutants. RK13 cells were incubated with protein extracts (0.2 mg ml−1) from wild type (60190::pCTB2cat) and each mutant strain. A negative control containing medium only was also included. After 24 h cells were examined for vacuolation by microscopy (original magnification ×20) and representative photographs taken. D. IL‐2 production in Jurkat T‐cells after incubation with Hpylori 60190 vacA stem‐loop mutants. Jurkat T‐cells were incubated with protein extracts (0.2 mg ml−1) from wild type (60190::pCTB2cat) and mutant strains for 1 h, after which PMA (P) and ionomycin (I) were added to stimulate cell proliferation. Controls were treated with P/I but no H . pylori protein extract [H2O (+ P/I)] or completely untreated [H2O (‐P/I)]. Cells were further incubated for 24 h before 100 μl of each sample was removed and centrifuged. IL‐2 levels in the remaining supernatants were then determined using ELISA. The graph shows the mean (+ SD) IL‐2 levels normalised to wild type (60190::pCTB2cat) of three independent experiments, each performed in triplicate. An ordinary one way ANOVA with Tukey's multiple comparison was used for statistical analysis. NS = not statistically significant.
Figure 5
Figure 5
Calculated vac A mRNA half‐lives of H . pylori 60190 vacA stem‐loop mutants. Growth from 24 h BA‐plates was used to inoculate 10 ml F12 Ham medium (supplemented with 10% FCS and 1% L‐glutamine). Cultures were incubated for 30 min in a microaerobic workstation with shaking at 200 r.p.m., after which rifampicin (100 μg ml−1) was added. Samples were then collected at given time points and used for RNA extraction and cDNA synthesis. The vacA mRNA expression relative to 16s rRNA expression was determined at each time point and used to plot a decay curve, from which the transcript half‐life for the wild type (60190::pCTB2cat) and each mutant strain could be calculated. The graph shows the mean calculated half‐life (+ SD) of at least three independent experiments. A one‐way ANOVA with Tukey's multiple comparison was used for statistical analysis. NS = not statistically significant.
Figure 6
Figure 6
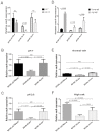
Steady‐state vac A mRNA levels in H . pylori 60190 stem‐loop mutants after exposure to environmental stress. A. Steady‐state mRNA levels after exposure to normal and acidic pH. Growth from 24 h BA‐plates was used to inoculate 10 ml normal (pH 7) or acidic (pH 2.5) F12 Ham medium (supplemented with 10% FCS and 1% L‐glutamine). Cultures were incubated for 30 min in a microaerobic workstation with shaking at 200 r.p.m. Samples were collected for RNA extraction and cDNA synthesis performed using reverse transcriptase. RT‐qPCR was then used to determine expression of vac A mRNA relative to 16s rRNA expression for the wild type (60190::pCTB2cat) and each mutant strain. B. Steady‐state vacA mRNA expression levels in H . pylori 60190 stem‐loop mutants at pH 7. C. Steady‐state vac A mRNA expression levels in H . pylori 60190 stem‐loop mutants at pH 2.5. D. Steady‐state vacA mRNA levels during normal and high environmental salt conditions. Growth from 24 h BA‐plates was used to inoculate 10 ml F12 Ham medium (supplemented with 10% FCS and 1% L‐glutamine) with normal (8 g l−1) or high (33 g l−1) NaCl. Cultures were incubated for 60 min in a microaerobic workstation with shaking at 200 r.p.m. Samples were collected for RNA extraction and cDNA synthesis performed using reverse transcriptase. RTqPCR was then used to determine expression of vac A mRNA relative to 16s rRNA expression for the wild type (60190::pCTB2cat) and each mutant strain under the two environmental conditions. E. Steady‐state vacA mRNA expression levels in H . pylori 60190 stem‐loop mutants during normal salt concentration. (F) Steady‐state vac A mRNA expression levels in H . pylori 60190 stem‐loop mutants during high salt concentration. All graphs show the mean (+ SD) vacA mRNA level of three independent experiments. An unpaired t‐test was used for statistical analysis.
Figure 7
Figure 7
H . pylori stem‐loop mutants vacA mRNA half‐lives during high environmental salt conditions. Growth from 24 h BA‐plates was used to inoculate 10 ml F12 Ham medium (supplemented with 10% FCS and 1% L‐glutamine) with high (33 g l−1) NaCl. Cultures were incubated for 60 min in a microaerobic workstation with shaking at 200 r.p.m., after which rifampicin (100 μg ml−1) was added. Samples were then collected at given time points and used for RNA extraction and cDNA synthesis. The vacA mRNA expression relative to 16s rRNA expression was determined at each time point and used to plot a decay curve, from which the transcript half‐life for the wild type (60190::pCTB2cat) and each mutant strain could be calculated. The graph shows the mean calculated half‐life (+ SD) of at least three independent experiments. A one way ANOVA with Tukey's multiple comparison was used for statistical analysis. NS = not statistically significant.

References

    1. Allan, E. , Clayton, C.L. , McLaren, A. , Wallace, D.M. , and Wren, B.W. (2001) Characterization of the low‐pH responses of Helicobacter pylori using genomic DNA arrays. Microbiology 147: 2285–2292. - PubMed
    1. Ang, S. , Lee, C.Z. , Peck, K. , Sindici, M. , Matrubutham, U. , Gleeson, M.A. , and Wang, J.T. (2001) Acid‐induced gene expression in Helicobacter pylori: study in genomic scale by microarray. Infect Immun 69: 1679–1686. - PMC - PubMed
    1. Atherton, J.C. , and Blaser, M.J. (2009) Coadaptation of Helicobacter pylori and humans: ancient history, modern implications. J Clin Invest 119: 2475–2487. - PMC - PubMed
    1. Atherton, J.C. , Cao, P. , Peek, R.M., Jr , Tummuru, M.K. , Blaser, M.J. , and Cover, T.L. (1995) Mosaicism in vacuolating cytotoxin alleles of Helicobacter pylori. Association of specific vacA types with cytotoxin production and peptic ulceration. J Biol Chem 270: 17771–17777. - PubMed
    1. Aviles‐Jimenez, F. , Letley, D.P. , Gonzalez‐Valencia, G. , Salama, N. , Torres, J. , and Atherton, J.C. (2004) Evolution of the Helicobacter pylori vacuolating cytotoxin in a human stomach. J Bacteriol 186: 5182–5185. - PMC - PubMed

Publication types

LinkOut - more resources